Introduction
One year after the election of Donald Trump, Congress and the Trump administration are due to decide the fate of hundreds of thousands of immigrants currently residing in the U.S. These immigrants have lived in the country with some form of protection from deportation, and with freedom to work and contribute to our economy. Most urgently, Congress must pass legislation to provide legal status to young people who were brought to the U.S. as children and have been protected from deportation by an Obama-era initiative known as Deferred Action for Childhood Arrivals (DACA). The Trump administration is phasing out DACA, giving Congress until March 2018 to find a permanent solution for the young immigrants known as Dreamers.[*]
This paper will look at public opinion surveys, including many commissioned by large media organizations that have been conducted since summer 2017, to gauge Americans’ attitudes on proposals for finding a solution for Dreamers. It also updates the National Immigration Forum’s previous surveys of public opinion on policy proposals to provide a path to legal status for undocumented immigrants and, more generally, attitudes toward immigrants. A few surveys asked the public about their attitudes on reform of the legal immigration system.
DACA and the DREAM Act
Unless Congress passes the DREAM Act or other legislation to provide protections for hundreds of thousands of immigrants who were brought to the U.S. as children, and who have grown up in the country, these young people will be subject to deportation.
How does the public feel about these young Americans in all but their papers? In poll after poll throughout 2017, Americans have expressed overwhelming support for allowing these young people to stay. Support was strong across party lines, and polls have shown increasing support into fall 2017. With support somewhat affected by the question’s wording, overall public support for allowing these immigrants to remain in the U.S. ranged from 55 percent to 88 percent. Support from those who identified as Republicans ranged from 45 percent to 79 percent. Support from independents ranged from 53 percent to 89 percent. Support from Democrats was consistently higher.
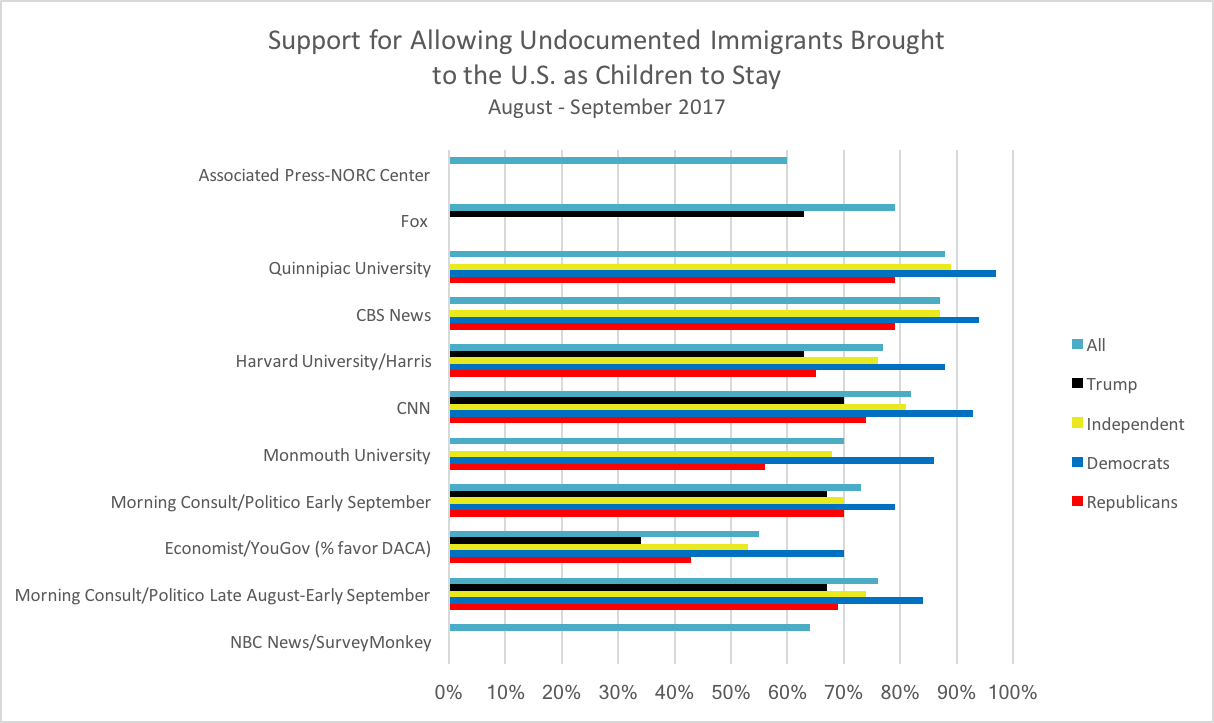
Starting in August 2017, an NBC News/SurveyMonkey survey asked a sample of more than 10,000 adults if they supported or opposed “the DACA (Deferred Action for Childhood Arrivals) policy, which protects those who were brought in the United States as undocumented children from being deported.” Supporters outnumbered opponents by more than two to one—64 percent to 30 percent.[1]
A survey conducted at the end of August and beginning of September 2017 by Morning Consult and Politico asked registered voters what they thought was the best way to handle “Dreamers [who] are young people who were brought to the United States illegally when they were children, often with their parents.” More than three-quarters (76 percent) of registered voters overall supported one of the two options for allowing them to remain in the U.S.—either allowing them “to stay and become citizens if they meet certain requirements,” or allowing them “to stay and become legal residents, but not citizens, if they meet certain requirements.” There was strong support across party lines for allowing Dreamers to stay; 84 percent of Democrats, 74 percent of independents and 69 percent of Republicans wanted to allow them to stay. Supporters included Trump voters (67 percent of whom supported allowing Dreamers to stay) and persons who consider themselves Tea Party supporters (69 percent).[2]
The survey also asked whether Dreamers “should be granted work permits,” and 68 percent of all respondents said yes.[3]
A poll conducted by The Economist and YouGov in early September 2017 tried to gauge support for DACA just prior to the administration’s announcement that it would be ending. Respondents were asked if they favored or opposed “DACA, Deferred Action for Childhood Arrivals, which is a policy that grants temporary legal status to ‘Dreamers,’ otherwise law-abiding children and young adults who were brought into the United States at a very young age by parents who are illegal immigrants.” There was overall support for the program (55 percent). Democrats (70 percent) and independents (51 percent) showed more support for the temporary program, while Republicans were split, with 43 percent in support and 40 percent opposed.[4]
A second question that tied action on DACA to President Trump obtained more polarized results. Respondents were told, “President Trump is considering ending DACA, which would result in ‘Dreamers’ losing their temporary legal status,” and were asked if they wanted “President Trump to keep the program or end it.” In response, 73 percent of Democrats wanted the President to keep the program, while just 30 percent of Republicans favored keeping the program. A plurality, but less than half, of Republicans (49 percent) wanted the president to end the program. (The rest were undecided.)[5]
In the days following the announcement by Attorney General Jeff Sessions that the administration would end the DACA program by March 2018, Morning Consult and Politico again asked a sample of registered voters several questions related to DACA. Respondents were asked how important it is for Congress to pass a bill “that grants young people who were brought to the United States illegally when they were children . . . protection from deportation.” Thirty-nine percent of respondents said it should be a “top priority,” and another 26 percent thought it should be an important (but lower) priority. Respondents were asked whether ending DACA, “an executive order issued in 2012 that granted eligible Dreamers protection from deportation,” was the “right thing or the wrong thing for President Trump to do.” More respondents thought it was the wrong thing to do (45 percent) than the right thing to do (35 percent).[6]
Respondents were asked what kind of legislation related to Dreamers they would most like Congress to pass. There was strong support for legislation allowing Dreamers to stay in the U.S., including 54 percent support for allowing them to “become citizens if they meet certain requirements.” An additional 19 percent supported legislation “that allows Dreamers to stay and become legal residents, but not citizens, if they meet certain requirements.” Just 12 percent of registered voters supported legislation that would result in the removal or deportation of Dreamers. In this survey, support for legislation allowing Dreamers to stay in the U.S. included 70 percent of Republicans, 67 percent of Trump voters and 69 percent of registered voters who identified as Tea Party supporters.[7]
In a separate question, respondents were asked if they believed that “legislation regarding Dreamers should be passed on its own, or passed as part of a larger immigration bill that addresses issues such as border security and the number of legal immigrants allowed into the U.S.” Respondents were more likely to favor a standalone bill protecting Dreamers (45 percent) than a bill that included border enforcement and legal immigration reform (33 percent favored that option). Democrats were more favorable to the standalone option (47 percent), while Republicans were evenly split, with 42 percent favoring the standalone option and 42 percent supporting Dreamer protection as part of the larger package.[8]
A poll conducted in September 2017 by Monmouth University asked its sample of adults if they would “support or oppose allowing people who illegally immigrated when they were children to automatically become U.S. citizens as long as they don’t have a criminal record.” Nearly half (46 percent) said they “strongly” supported this idea, while an additional 24 percent said they “somewhat” supported the idea. Net support for citizenship for undocumented immigrants who came as children crossed party lines (56 percent for Republicans, 68 percent for independents and 86 percent for Democrats). There was no difference in support from Trump voters (56 percent) as there was from Republicans overall.[9]
A Wall Street Journal and NBC News poll conducted in September 2017 asked respondents to rate their feelings toward “Dreamers, who are young adults whose family brought them to this country illegally when they were children.” Nearly a third (31 percent) said their feelings were “very positive” about Dreamers, with an additional 20 percent saying their feelings were “somewhat positive.” Just 19 percent had “somewhat” or “very” negative feelings toward Dreamers.[10]
A CNN poll, also conducted in September 2017, asked its nationwide sample of adults if they thought the U.S. should continue or end “a U.S. government program [that] allows some immigrants who were brought to the U.S. illegally as children to remain in the U.S. without risk of deportation.” The question noted that, in order to qualify for the program, “immigrants had to be under the age of 30 as of 2012, have no criminal record, and be a student, in the military or have earned a high school diploma.” More than four in five respondents (82 percent) thought the U.S. should “continue this policy and allow immigrants who meet these qualifications to remain in the U.S.” Just under three-quarters of Republicans (74 percent) agreed with this choice, as did 81 percent of independents and 93 percent of Democrats. Trump voters were only marginally less sympathetic than Republicans overall, with 70 percent responding that the U.S. should continue a policy that allows these immigrants to stay in the U.S.[11]
Another September 2017 survey, by ABC News, found that 69 percent of respondents “strongly” supported “a program that allows undocumented immigrants to stay in the United States if they arrived here as a child, completed high school or military service and have not been convicted of a serious crime.” An additional 18 percent said they “somewhat” supported such a program, for a net of 86 percent support.[12]
Latino Decisions conducted a nationwide survey of Latino adults in mid-September 2017 to take a snapshot of how Latinos feel about the immigration policies under discussion. The DREAM Act and immigration reform is a much higher priority for this group than it is for other Americans. When asked, “What are the most important issues facing the Latino community that you think Congress and the President should address?” the top choice in a list of 13 issues was “Immigration reform/DREAM Act,” with 53 percent of respondents choosing that issue as their top choice. Respondents were asked if they thought it was a good idea, or a bad idea, for Congress to “pass the DREAM Act, which would allow young undocumented immigrants who came to this country as children the chance to live and work legally in the United States and eventually apply for permanent legal status and earn a path to citizenship.” Ninety-one percent of respondents thought it was a good idea.[13]
A Harvard University/Harris Poll conducted mid- to late-September 2017 with a large sample of more than 2,000 registered voters found very strong support for “work permits and a path to citizenship for people between 15-36 years of age brought to the U.S. illegally by their parents when they were children.” Only 23 percent were opposed to the idea, while 77 percent favored it. The idea was supported by strong majorities across party lines: 65 percent of Republicans, 88 percent of Democrats and 76 percent of independents. Trump voters also reacted favorably to this idea (63 percent were supportive). The overwhelming majority (80 percent) of all voters thought that the question of what to do about “illegal immigrants brought to the U.S. by their parents when they were children” should be decided by Congress. Only 20 percent thought it should be decided by executive action. The public was split 50/50 over the Trump administration’s decision to end DACA, “pushing the issue back to Congress.”[14]
This poll also asked respondents whether Congress should “act to restore work permits to those brought to the U.S. illegally as kids or . . . let those rights end.” Again, a strong majority favored a positive solution for these immigrants; 72 percent said Congress should act to restore work permits, while 28 percent said Congress should let the permits expire. The poll also asked whether “restoration of work permits for those brought to the U.S. as kids [should] be passed alone or as part of a deal that includes border security.” A slight majority (53 percent) said the restoration of work permits should be passed alone, while 47 percent favored a larger deal that would include border security. Not surprisingly, Republicans were more supportive of a deal with border security (68 percent) compared to Democrats (30 percent) and independents (45 percent).[15]
A CBS News poll in late September 2017 asked, “Do you favor or oppose allowing young immigrants who were brought to the U.S. illegally as children to remain in the country if they meet certain requirements such as going to school or joining the military, and not having a criminal record?” In response, 87 percent of respondents said they favored allowing these immigrants to remain in the U.S. Just one in ten opposed. Strong majorities across party lines favored allowing these young immigrants to stay: 79 percent of Republicans, 94 percent of Democrats and 87 percent of independents. Respondents were also asked if they thought “young immigrants who were brought to the U.S. illegally as children and raised in this country mostly have a positive influence on U.S. society, a negative influence on U.S. society, or not much effect.” A majority, 55 percent, said they thought these immigrants had a positive effect, while only one in ten said they thought they had a negative effect.[16]
In a Quinnipiac University poll conducted in late September 2017, respondents were asked whether they “support or oppose granting legal status and work permits to undocumented immigrants who were brought to the U.S. as children.” Consistent with other surveys conducted in this timeframe, there was broad public support for allowing these undocumented immigrants to stay. Republican support was weakest but still strong, at 57 percent, compared with 36 percent who oppose the idea. Nearly all Democrats (92 percent) favored allowing these immigrants to stay, while independents were also strongly supportive, at 78 percent.[17]
Voters overall and across party lines were even more supportive of allowing these immigrants to stay when a more specific question was asked about what should be done with them. Respondents were asked which came closest to their view “about undocumented immigrants who were brought to the U.S. as children.” The most popular option, favored by 82 percent of total voters, including 69 percent of Republicans, 95 percent of Democrats and 82 percent of independents, was to allow them “to stay in the United States and to eventually apply for U.S. citizenship.” An additional 6 percent of voters overall—10 percent of Republicans, 2 percent of Democrats and 7 percent of independents—favored allowing them “to remain in the United States, but not be allowed to apply for U.S. citizenship.”[18]
The results of a late September 2017 Fox News poll echoed those of other polls conducted in the previous weeks. Overall, 86 percent of respondents favored work permits for “illegal immigrants under the age of 30 brought here as children, provided they pass a background check.” Only 12 percent opposed. A similarly strong majority, 79 percent, favored U.S. citizenship for these immigrants. A strong majority of respondents to this poll, 62 percent, thought it was extremely or very important to pass a law to address Dreamers. This was higher than the percentage of respondents who said it was extremely or very important to pass health-care reform (58 percent) or tax reform (52 percent). There was little difference between partisans in support for Congress to act; 66 percent of Democrats, 60 percent of Republicans and 59 percent of independents said it was important for Congress to act regarding Dreamers. Similarly, there was bipartisan support for work permits and for citizenship for Dreamers, including 63 percent of Trump voters who supported citizenship.[19]
The Associated Press and NORC Center for Public Affairs Research conducted a poll at the end of September/early October 2017 in which 60 percent of respondents favored “providing a way for immigrants who were brought to the United States illegally as children to stay legally.” In this poll, respondents were also given the choice of being neutral (neither favor nor oppose), and 16 percent were neutral. Among those who were opposed or neutral to allowing these immigrants to stay legally, fewer than half (47 percent) say that “the government should try to deport all immigrants who were brought to the United States illegally as children.” (In other words, about 19 percent of the larger sample favors deportation, a finding consistent with other polls.) Among those who favored allowing these immigrants to stay in the U.S., 66 percent said they supported “Donald Trump using his presidential powers to protect them from deportation,” if Congress doesn’t act.[20]
The Public Religion Research Institute asked a large sample of U.S. adults in October 2017 whether they favored or opposed “allowing illegal immigrants brought to the U.S. as children to gain legal resident status if they join the military or go to college.” Seventy-two percent of respondents favored this idea, while 25 percent opposed it.[21]
A November Politico/Morning Consult poll asked registered voters how much of a priority it should be for Congress to pass a “bill that grants young people who were brought to the United States illegally when they were children, often with their parents, protection from deportation.” Some 29 percent of respondents thought it should be a top priority or an “important but lower priority” (27 percent). Only 15 percent said it should not be done.[22]
A CBS News poll in early December 2017 asked respondents if they favored or opposed “allowing young immigrants who were brought to the U.S. illegally as children to remain in the country if they meet certain requirements such as going to school or joining the military, and not having a criminal record.” Respondents who favored allowing these immigrants to stay in the U.S. outnumbered opponents by six to one (84 percent to 14 percent). Democrats (93 percent) and independents (82 percent) showed overwhelming support, and Republican supporters outnumbered opponents about three to one (74 percent to 23 percent).[23]
In a December 2017 Marist Poll of U.S. adults, respondents were asked if they thought “children known as ‘Dreamers’ who came with parents to the U.S. illegally should be allowed to stay in the United States.” Overall, 81 percent of respondents said yes, including 58 percent who thought Dreamers should be allowed to become citizens and 23 percent who thought Dreamers should be allowed to become legal residents but not citizens. Strong majorities favored allowing Dreamers to stay, including 92 percent of Democrats, 67 percent of Republicans (including 65 percent of Trump supporters), and 82 percent of independents.[24]
A Quinnipiac University poll in December asked respondents which came closer to their view about “undocumented immigrants who were brought to the U.S. as children.” Supporters of allowing these immigrants to stay in the U.S. outnumbered opponents by seven to one in this poll. Across party lines, a majority of respondents (including 57 percent of Republicans, 91 percent of Democrats and 81 percent of independents) said these immigrants “should be allowed to stay in the United States and to eventually apply for U.S. citizenship.” An additional 13 percent of Republicans, 4 percent of Democrats and 7 percent of independents said they should be allowed to stay “but not be allowed to apply for U.S. citizenship.”[25]
In an NBC News/Wall Street Journal poll conducted in December, respondents were told: “There is currently a program that allows young adults who were brought to this country illegally by their parents when they were children to stay here legally to attend college or work. This program will end in three months unless Congress takes action. If the program ends, almost 700,000 of these young adults could face the prospect of deportation.” When asked if they thought Congress “should vote to continue this program” or “take no action so this program ends,” 62 percent of respondents said Congress should continue the program, while just 19 percent thought Congress should take no action. (Another 19 percent said they had no opinion.)[26]
A December CNN poll of U.S. adults nationwide echoed several other polls conducted late in the year. In this survey, respondents were asked what they thought the U.S. should do with “a U.S. government program [that] allows some immigrants who were brought to the U.S. illegally as children to remain in the U.S. without risk of deportation. To qualify, immigrants had to be under the age of 30 as of 2012, have no criminal record, and be a student, in the military or have earned a high school diploma.” Across party lines, respondents said they thought the U.S. should “continue this policy and allow immigrants who meet these qualifications to remain in the U.S.” Two-thirds (67 percent) of Republicans favored continuing this program, including 65 percent of those who said they approved of President Trump. Nearly all Democrats in the sample (94 percent) were in favor, as well as most independents (83 percent).[27]
General Views on Immigration and Diversity
As discussed above, many polls have shown the public to be overwhelmingly sympathetic to young undocumented immigrants brought to the U.S. as children. But in the past few months, polls have shown the public to be more favorable in general to immigration and to current levels of immigration. Some reports have noted that the percent of the polling public that views immigration or immigrants as a threat or liability has been trending downward and is at a historic low.
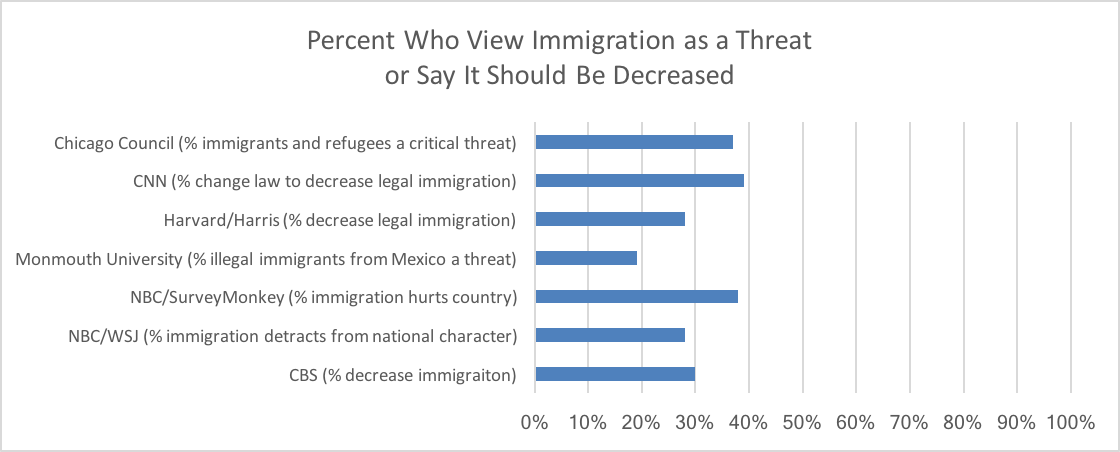
In August 2017, CBS News asked a national sample of adults whether they thought “legal immigration into the United States [should] be kept at its present level, increased, or decreased.” A plurality, 43 percent, thought that immigration should be kept at its present level. Another 23 percent thought immigration should be increased. Just 30 percent thought immigration should be decreased. A plurality of Republicans (45 percent) felt immigration should be decreased, while a majority of Democrats (52 percent) and a plurality of independents (41 percent) said immigration should be kept at present levels.[28]
Also in August, The Wall Street Journal and CBS News released a nationwide survey. Respondents were read a list of issues (excluding the economy, national defense and foreign policy) and were asked which of the issues were “important enough to you to have an impact on how you vote in an election.” Immigration issues came in third, behind gun rights/gun control and environmental issues. [29]
Respondents in this survey were asked which came closer to their view: “Immigration adds to our character and strengthens the United States because it brings diversity, new workers and creative talent to this country,” or, “Immigration detracts from our character and weakens the United States because it puts too many burdens on government services, causes language barriers and creates housing problems.” Nearly two-thirds (64 percent) said they believe immigration strengthens the country. This is up 10 points from four years ago, and a positive view of immigration, as measured by this question, has been trending steadily upward since 2005.[30]
In the NBC News/SurveyMonkey survey from August 2017, respondents were asked whether they thought immigration helped the United States more that it hurt, or vice versa. A majority, 57 percent, said they thought immigration helped this country more than it hurt. Just 38 percent thought the reverse.[31]
The September 2017 Monmouth University poll mentioned above asked respondents whether they felt that “illegal immigrants from Mexico” were a threat to their “own personal way of life.” Just 19 percent said they were. One year ago, more than a quarter of registered voters who were asked that question said that illegal immigrants were a threat. Trump voters felt more threatened by “illegal immigrants from Mexico,” but only 37 percent said they were threatened. Republicans overall felt somewhat less threatened than Trump voters (31 percent). The survey notes that, since 2015, there has been a significant drop in the percentage of Republicans who said that they felt threatened—from 51 percent in 2015 to 31 percent in this survey. The Republican shift accounted for most of the overall decline in the proportion of respondents who felt threatened, falling from 28 percent in 2015 to 19 percent in this survey.[32]
In September 2017, a Harvard University/Harris poll asked respondents if they thought “legal immigration into the United States [should] be kept at its present level, increased or decreased.” A majority of respondents said legal immigration should be kept at its current level. About a quarter (28 percent) of respondents said it should be decreased, while 18 percent favored an increase.[33]
A mid-September 2017 CNN poll asked respondents if they favored or opposed “changes in federal law to reduce the number of immigrants who enter the country legally.” Just 39 percent of respondents said they favored reducing the number of immigrants, verses 55 percent who said they opposed reducing the number. CNN compared the response to that question to the response given in 1994, when 64 percent of respondents said they favored a reduction in immigration.[34]
The Chicago Council on Global Affairs released its annual poll in October 2017 that showed that the public’s perception of immigration as a threat was at an all-time low since their 1998 polling. Respondents were asked about their views of “possible threats to the vital interests of the United States in the next 10 years.” Overall, 37 percent of respondents said they viewed “large numbers of immigrants and refugees coming to the United States” as a “critical threat.” While this represents a record low for the public overall, the downward trend in viewing immigration as a threat is not uniform. A majority of Republicans have consistently viewed immigration as a threat (56 percent in 1998; 61 percent in 2017). Independents and Democrats have driven the trend away from viewing immigration as a critical threat in this poll. Both groups registered record lows in that view in 2017: 20 percent for Democrats and 36 percent for independents (compared to 58 percent and 51 percent, respectively, in 1998).[35]
Legal Status for Undocumented Immigrants
As has been the case for more than a decade, there is strong public support for providing legal status for undocumented immigrants who are living and working in the U.S., provided they meet certain conditions. If anything, public sympathy has increased in recent months as Americans watch immigration enforcement move away from a focus on criminals to sweeps of communities where ordinary workers, business owners and even pastors and other community leaders are being picked up to be deported. These polls show that support for allowing undocumented immigrants to stay comes not only from Democrats but from independents and Republicans as well. Even Trump voters are sympathetic to allowing undocumented immigrants to remain in the U.S. provided they meet certain conditions.
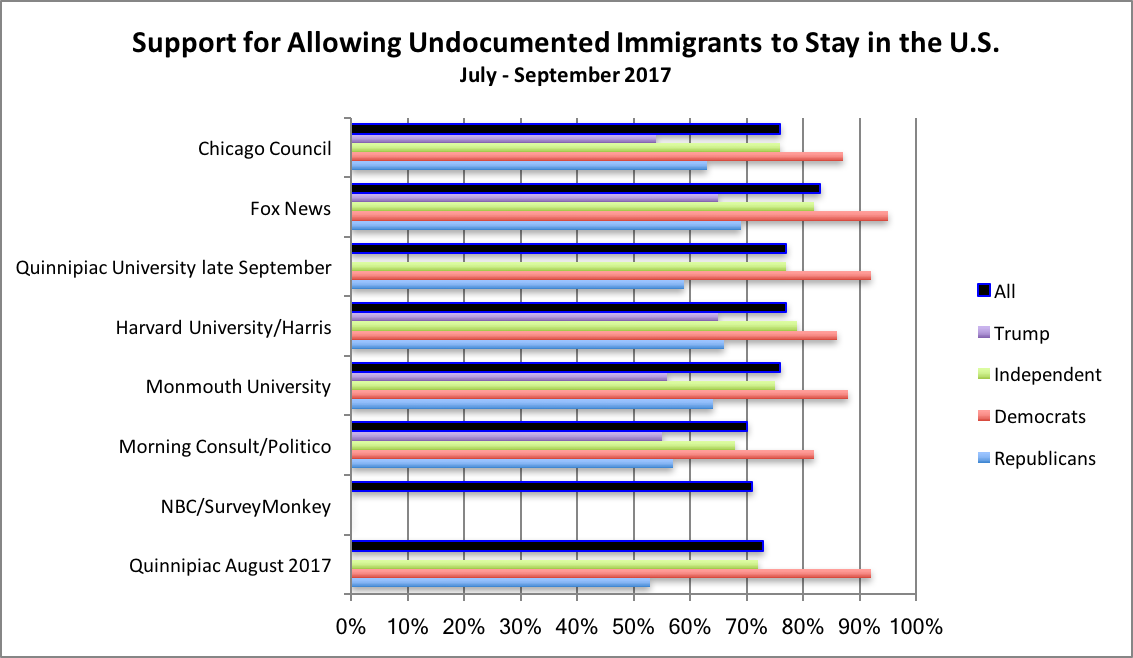
A Quinnipiac University poll released in August 2017 asked respondents which came closer to their view “about illegal immigrants who are currently living in the United States.” Nearly three-quarters (73 percent) favored allowing them to stay, including 63 percent who said that they should be allowed to “eventually apply for U.S. citizenship.” Just 22 percent said they should be required to leave. Support for allowing these immigrants to remain in the U.S. extends across party lines, with Democrats (92 percent), Republicans (53 percent) and independents (72 percent) all in support of the combined “remain in the U.S.” options. There was not a huge difference in support across age cohorts: 77 percent of 18- to 34-year-olds, 77 percent of 35- to 49-year-olds, 72 percent of 50- to 64-year-olds and 74 percent of respondents ages 65 and over are all in favor of allowing undocumented immigrants to remain in the U.S.[36]
The NBC News/SurveyMonkey poll from August 2017 asked respondents how they thought undocumented immigrants working in the U.S. should be treated. Seventy-one percent said they thought undocumented immigrants should be “offered a chance to apply for legal status.” Just 26 percent thought they should be deported.[37]
The August/September 2017 Morning Consult and Politico poll asked registered voters what they thought was “the best way to handle immigrants currently living in the United States illegally.” A total of 70 percent said that these immigrants should be allowed to either become citizens or be legalized without becoming citizens if they meet certain requirements. Majority support for legal status or legal status with citizenship for undocumented immigrants crossed party lines: 82 percent for Democrats, 68 percent for independents and 57 percent for Republicans, including 55 percent of those who voted for Trump. Support for allowing undocumented immigrants to become citizens was highest among Democrats (64 percent). Only 22 percent of registered voters overall favored deportation.[38]
The September 2017 Monmouth University poll asked respondents, “If you had to choose, what do you think should happen to most illegal immigrants who have lived and worked in the U.S. for at least two years?” More than three-quarters (76 percent) said that these immigrants “should be given a chance to keep their jobs and eventually apply for legal status.” Only 19 percent said they “should be deported back to their native country.” Strong majorities across party identification favored allowing undocumented immigrants to stay, including 64 percent of Republicans, 75 percent of independents and 88 percent of Democrats. A majority of Trump voters (56 percent) also favored allowing these immigrants to remain in the country and keep their jobs. Support for deportation has dropped markedly among Republicans in the past two years, from 43 percent to 30 percent.[39]
The September 2017 Harvard University/Harris poll found that more than three-quarters (77 percent) of its large sample of registered voters favored “Congress providing a way for undocumented immigrants who are currently in the U.S. to gain legal citizenship if they learn English, pay fines or back taxes, and have jobs that pay taxes.” Large majorities in favor of this idea prevailed across party lines: 66 percent of Republicans (including 65 percent of Trump voters), 86 percent of Democrats and 79 percent of independents.[40]
Another mid-September 2017 poll conducted by CNN asked respondents what the government’s top priority should be in “dealing with immigrants already living in the U.S. illegally.” Eighty-four percent of respondents said that the top priority should be “developing a plan to allow some people living in the U.S. illegally to become legal residents.” Strong majorities across party lines agreed: 76 percent of Republicans, 82 percent of independents and 93 percent of Democrats. Only 13 percent of respondents overall said the top priority should be “deporting all people living in the U.S. illegally.”[41]
In late September 2017, Quinnipiac University conducted a poll that included several immigration-related questions. Respondents were asked which came closest to their view about “illegal immigrants who are currently living in the United States.” Overall, 68 percent said that “they should be allowed to stay in the United States and to eventually apply for U.S. citizenship.” An additional 9 percent said that they “should be allowed to remain in the United States, but not be allowed to apply for U.S. citizenship,” for a total of 77 percent who favored allowing immigrants to remain in the U.S. Only 19 percent of respondents overall said these immigrants “should be required to leave the U.S.” Those in favor of allowing undocumented immigrants to stay included majorities across party lines: Republicans (59 percent), Democrats (92 percent) and independents (77 percent).[42]
Respondents were also asked who they thought should be deported among “people who have immigrated to the U.S. illegally”: “No illegal immigrants [should] be deported,” “only illegal immigrants that have committed a serious crime,” “only illegal immigrants that have committed any crime,” or “all illegal immigrants.” A majority, 52 percent, said that only those who have committed a serious crime should be deported. Just 23 percent said immigrants who have committed any crime should be deported, and one-in-five said all should be deported.[43]
A Fox News poll in late September 2017 found record high support in Fox’s polling on the issue for legalization for undocumented immigrants. Eighty-three percent of respondents favored “setting up a system for all illegal immigrants who are currently working in the country to become legal residents.” Just 14 percent favored deportation for “as many as possible.” There was strong bipartisan support for the legalization of undocumented immigrants: 95 percent of Democrats, 82 percent of independents and 69 percent of Republicans favored legalization. Support for legalization has increased markedly since Fox tested this idea in July 2015, when 64 percent of the public favored legal status for the undocumented.[44]
The October 2017 report from the Chicago Council on Global Affairs noted the growing public consensus for allowing undocumented immigrants to remain in the U.S. and declining support for deportation. However, the council notes the consensus is marked by partisan divides. Respondents were asked which comes closest to their views “about illegal immigrants who are currently working in the United States.” The top choice overall, at 38 percent, was that these immigrants “should be allowed to stay in their jobs and to apply for U.S. citizenship.” An additional 27 percent said that these immigrants “should be allowed to stay in their jobs and eventually to apply for U.S. citizenship only if they pay a penalty and wait a number of years.” In total, 65 percent of respondents said that these immigrants should be allowed to apply for citizenship. Eleven percent thought these immigrants “should be allowed to stay in their jobs with work permits but not to apply for U.S. citizenship.” Only 22 percent overall said that undocumented immigrants should be required to leave their jobs and the United States.”[45]
Democrats favored allowing undocumented immigrants to stay and apply for citizenship (with or without conditions) by 77 percent. For independents, the percentage was 63 percent for these two options. Still, a majority of Republicans (52 percent) favored the combined citizenship options, and if the option of work permits without citizenship is included, even a majority of Trump supporters favored allowing undocumented immigrants to remain in the U.S. (54 percent).[46]
Reform of the Legal Immigration System
In the summer of 2017, Republicans in Congress, with the backing of President Trump, proposed reforming our immigration system to de-emphasize immigration through family ties and to prioritize immigrants with education and skills while cutting total immigration numbers in half. Some surveys asked questions related to this proposal. Depending on how the question was asked, the public was split over the proposal, but if the question noted that a reduction in immigration was included as part of the package, the public was generally opposed.
An August 2017 CBS News survey mentioned above asked whether “priority [should] be given to people who have family members already living in the U.S., or . . . to people based on education, job skills and work experience.” A slim plurality (46 percent) favored admitting immigrants based on their background, while 44 percent said that family should be prioritized.[47]
One question in the August 2017 NBC News/Wall Street Journal survey first described a “proposal that would change the immigration system to a merit-based system that favors applicants based upon their skills, education and ability to speak English.” Such a system “would mean that many immigrants who have family members in the United States would not be allowed to live here permanently and would effectively cut legal immigration by about 50 percent.” Only 27 percent of respondents thought that proposal was “a good idea,” while 45 percent thought it was a “bad idea.”[48]
Quinnipiac University’s August 2017 survey asked respondents whether they supported or opposed “a proposal to cut in half the number of legal immigrants coming into the United States, with priority given to immigrants with job skills rather than to immigrants with family ties.” A plurality, 48 percent, opposed the proposal, compared with 44 percent who support the proposal.[49]
The ABC News/Washington Post poll from September 2017 asked respondents whether they would “support or oppose reducing the number of legal immigrants allowed into the U.S. by half.” There was only 39 percent support for this proposal, verses 55 percent who were opposed.[50]
The September 2017 Harvard University/Harris poll asked whether respondents thought that “priority in immigration should be given to people with job skills the U.S. needs or to relatives of people already here.” Two-thirds said priority should be given to people with job skills, while one-third said priority should be given to people with relatives here.[51]
The CNN mid-September 2017 poll asked respondents which should be more important “when considering whether to grant a non-citizen the right to live in the U.S. legally.” A person’s job skills and education was the response of a majority, 51 percent, compared to 37 percent who said “the person’s family members already living in the U.S.”[52]
The November 2017 Politico/Morning Consult poll mentioned above asked questions to gauge which traits Americans think are important for immigrants to have when coming to the country. One question asked respondents which factors should be used “in determining who is allowed to legally immigrate to the United States.” Out of the list supplied by the poll takers, there was most support (53 percent) for English-language ability. That was followed closely by “ties to family members in the United States” (52 percent). There was plurality support for “record of professional or academic achievement” (47 percent), education (47 percent), “need for government assistance” (46 percent) and “entrepreneurial initiative (38 percent). There was less support for “high-paying job offers” (35 percent) and less still for age as a factor in determining who should be allowed to immigrate (26 percent).[53]
[*] The name comes from the DREAM Act, pending legislation that would provide these undocumented immigrants brought to the U.S. as children with a path to legal status.
[1] NBC/SurveyMonkey Poll Results, conducted online August 24 to August 29, 2017, with a sample of 10,129 U.S. adults. http://msnbcmedia.msn.com/i/TODAY/z_Creative/NBC%20News%20SurveyMonkey%20Poll%20Toplines%20and%20Methodology%208.24-8.29.pdf.
[2] Morning Consult and Politico, “National Tracking Poll #170917,” https://morningconsult.com/wp-content/uploads/2017/09/170817_crosstabs_Politico_v1_TB.pdf. This poll was conducted August 31 – September 3, 2017, with a sample of 1,993 registered voters nationwide.
[3] Morning Consult and Politico, “National Tracking Poll #170917,” https://morningconsult.com/wp-content/uploads/2017/09/170817_crosstabs_Politico_v1_TB.pdf. This poll was conducted August 31 – September 3, 2017, with a sample of 1,993 registered voters nationwide.
[4] The Economist/YouGov Poll, https://d25d2506sfb94s.cloudfront.net/cumulus_uploads/document/izyxurbn73/daca_tables.pdf. This poll was conducted September 3 – 5, 2017, with a sample of 1,500 U.S. adults.
[5] The Economist/YouGov Poll, https://d25d2506sfb94s.cloudfront.net/cumulus_uploads/document/izyxurbn73/daca_tables.pdf. This poll was conducted September 3 – 5, 2017, with a sample of 1,500 U.S. adults.
[6] Morning Consult and Politico, “National Tracking Poll #170904,” https://www.politico.com/f/?id=0000015e-7850-df5f-a1fe-ffd34aac0000. This poll was conducted September 7 – 11, 2017, among a national sample of 1,976 registered voters.
[7] Morning Consult and Politico, “National Tracking Poll #170904,” https://www.politico.com/f/?id=0000015e-7850-df5f-a1fe-ffd34aac0000. This poll was conducted September 7 – 11, 2017, among a national sample of 1,976 registered voters.
[8] Morning Consult and Politico, “National Tracking Poll #170904,” https://www.politico.com/f/?id=0000015e-7850-df5f-a1fe-ffd34aac0000. This poll was conducted September 7 – 11, 2017, among a national sample of 1,976 registered voters.
[9] Monmouth University Poll, “National: Public Takes Softer Stance on Illegal Immigration,” https://www.monmouth.edu/polling-institute/reports/MonmouthPoll_US_092117/. This poll was conducted September 15 to 19, 2017, with a sample of 1,009 U.S. adults.
[10] NBC News/Wall Street Journal Survey, http://msnbcmedia.msn.com/i/MSNBC/Sections/A_Politics/HUB_NBCPolitics_Front/17363%20NBCWSJ%20September%20Poll%20(9-21-17%20Release).pdf. This survey was conducted September 14 to 18, 2017, with a sample of 900 adults nationwide.
[11] CNN September 2017, http://i2.cdn.turner.com/cnn/2017/images/09/27/cnnssrspoll.pdf. This nationwide survey of 1,053 adults was conducted September 17 to 20, 2017.
[12] ABC News/Washington Post, “Americans Back DACA by a Huge Margin,” http://www.langerresearch.com/wp-content/uploads/1191a4DACAandImmigration.pdf. This poll was conducted September 18 to 21 with a sample of 1,002 adults nationwide.
[13] Latino Decisions, “National Latino Survey 2017,” http://www.latinodecisions.com/files/4015/0652/1612/LVP_LD_09.28_Release_Toplines.pdf. This survey was conducted September 12 to 19, 2017, with a sample of 755 Latino adults nationwide.
[14] Harvard Harris Poll. Key findings: http://harvardharrispoll.com/wp-content/uploads/2017/10/Harvard-Harris-Poll_September_Report_092517.pptx. Crosstabs: http://harvardharrispoll.com/wp-content/uploads/2017/09/HHP-September-Wave_Topline-Memo_Custom-Banners_Registered-Voters.pdf. This survey was conducted September 17 to 20, 2017, with a national sample of 2,177 registered voters.
[15] Harvard Harris Poll. Key findings: http://harvardharrispoll.com/wp-content/uploads/2017/10/Harvard-Harris-Poll_September_Report_092517.pptx. Crosstabs: http://harvardharrispoll.com/wp-content/uploads/2017/09/HHP-September-Wave_Topline-Memo_Custom-Banners_Registered-Voters.pdf. This survey was conducted September 17 to 20, 2017, with a national sample of 2,177 registered voters.
[16] CBS News Poll, “Americans Disapprove of President’s Handling of Health Care, North Korea,” https://docs.cbsnews.com/20/toplines-cbs-pm-poll-9-25-17.pdf. This survey was conducted September 21 to 24 with a national sample of 1,202 adults.
[17] Quinnipiac University, “Dreamers Should Stay, U.S. Voters Say 5-1 Quinnipiac University National Poll Finds; Voters Losing Hope For Peaceful Fix In North Korea,” https://poll.qu.edu/national/release-detail?ReleaseID=2488. This survey consisted of a sample of 1,412 registered voters nationwide and was conducted September 21 to 26, 2017.
[18] Quinnipiac University, “Dreamers Should Stay, U.S. Voters Say 5-1 Quinnipiac University National Poll Finds; Voters Losing Hope For Peaceful Fix In North Korea,” https://poll.qu.edu/national/release-detail?ReleaseID=2488. This survey consisted of a sample of 1,412 registered voters nationwide and was conducted September 21 to 26, 2017.
[19] Fox News Poll: “83 percent support pathway to citizenship for illegal immigrants,” http://www.foxnews.com/politics/2017/09/28/fox-news-poll-83-percent-support-pathway-to-citizenship-for-illegal-immigrants.html. This poll was conducted September 24 to 26 with a sample of 1,107 registered voters nationwide.
[20] Associated Press-NORC Center for Public Affairs Research, “The September 2017 AP-NORC Center Poll,” http://www.apnorc.org/PDFs/AP-NORC%20September%202017/AP%20Custom%20Poll%20Topline%20SEPTEMBER_immigration.pdf. This poll was conducted between September 28 and October 2, 2017, with a sample of 1,150 adults nationwide.
[21] Public Religion Research Institute, “2017 American Values Survey,” https://www.prri.org/wp-content/uploads/2017/12/2017-AVS-Topline-FINAL.pdf. This survey was conducted between October 18 and 30, 2017, with a nationwide sample of 2,019 adults.
[22] Politico/Morning Consult, “National Tracking Poll #171102” https://morningconsult.com/wp-content/uploads/2017/11/171102_crosstabs_POLITICO_v1_AP.pdf. This poll was conducted November 2 – 6, 2017, with a sample of 1,991 registered voters nationwide.
[23] CBS News poll, “Americans say tax plan helps wealthy, not middle class,” https://www.cbsnews.com/news/cbs-news-poll-americans-say-tax-plan-helps-wealthy-not-middle-class/. This poll was conducted December 3 – 5, 2017, with a nationwide sample of 1,120 adults.
[24] Marist Poll http://maristpoll.marist.edu/wp-content/misc/usapolls/us171204_KoC/Marist%20Poll%20National%20Nature%20of%20the%20Sample%20and%20Tables_December%202017.pdf#page=3. This poll was conducted December 4 – 7, 2017, with a sample of 1,267 U.S. adults.
[25] Quinnipiac University, “Support For GOP Tax Plan Could Hurt Candidates, Quinnipiac University National Poll Finds; U.S. Voters Say 7-1 DACA Immigrants Should Stay” https://poll.qu.edu/national/release-detail?ReleaseID=2508. This poll was conducted December 6 – 11, 2017, with a nationwide sample of 1,211 voters.
[26] NBC News/Wall Street Journal Survey, http://msnbcmedia.msn.com/i/MSNBC/Sections/17505%20NBCWSJ%20December%20Poll.pdf. This survey was conducted December 13 – 15, 2017, with a national sample of 900 adults.
[27] CNN December 2017, http://cdn.cnn.com/cnn/2017/images/12/18/rel12a.-.trump.and.taxes.pdf. This poll was conducted December 14 – 17, 2017, with a nationwide sample of 1,001 adults.
[28] CBS News, “Americans Frustrated with Congress,” August 3 – 6, 2017. https://www.scribd.com/document/355851193/Cbs-News-Poll-Toplines-Congress-Release-8-8-17. Sample: 1,111 adults nationwide.
[29] NBC News/Wall Street Journal Survey, August 5 – 9. https://www.wsj.com/public/resources/documents/17312NBCWSJ2017SocialTrendsPoll09062017Release.pdf. Sample: 1,200 adults, nationwide, including 994 registered voters.
[30] NBC News/Wall Street Journal Survey, August 5 – 9. https://www.wsj.com/public/resources/documents/17312NBCWSJ2017SocialTrendsPoll09062017Release.pdf. Sample: 1,200 adults, nationwide, including 994 registered voters.
[31] NBC/SurveyMonkey Poll Results, conducted online between August 24 to 29, 2017, with a sample of 10,129 U.S. adults. http://msnbcmedia.msn.com/i/TODAY/z_Creative/NBC%20News%20SurveyMonkey%20Poll%20Toplines%20and%20Methodology%208.24-8.29.pdf.
[32] Monmouth University Poll, “National: Public Takes Softer Stance on Illegal Immigration,” https://www.monmouth.edu/polling-institute/reports/MonmouthPoll_US_092117/. This poll was conducted September 15 to 19, 2017, with a sample of 1,009 U.S. adults.
[33] Harvard Harris Poll. Key findings: http://harvardharrispoll.com/wp-content/uploads/2017/10/Harvard-Harris-Poll_September_Report_092517.pptx. Crosstabs: http://harvardharrispoll.com/wp-content/uploads/2017/09/HHP-September-Wave_Topline-Memo_Custom-Banners_Registered-Voters.pdf. This survey was conducted September 17 to 20, 2017, with a national sample of 2,177 registered voters.
[34] CNN September 2017, http://i2.cdn.turner.com/cnn/2017/images/09/27/cnnssrspoll.pdf. This nationwide survey of 1,053 adults was conducted September 17 to 20, 2017.
[35] Chicago Council on Global Affairs, “What Americans Think about America First,” https://www.thechicagocouncil.org/sites/default/files/ccgasurvey2017_what_americans_think_about_america_first.pdf. This survey was conducted June 27 to July 19, with a sample of 2,020 adults nationwide. The report was published in October.
[36] Quinnipiac University, “86% of U.S. Voters Want to Negotiate with North Korea, Quinnipiac University National Poll Finds; But Most Not Confident Trump Can Handle It,” conducted August 9 – 15, with a sample of 1,361 registered voters. https://poll.qu.edu/national/release-detail?ReleaseID=2480.
[37] NBC/SurveyMonkey Poll Results, conducted online between August 24 to 29, 2017, with a sample of 10,129 U.S. adults. http://msnbcmedia.msn.com/i/TODAY/z_Creative/NBC%20News%20SurveyMonkey%20Poll%20Toplines%20and%20Methodology%208.24-8.29.pdf.
[38] Morning Consult and Politico, “National Tracking Poll #170917,” https://morningconsult.com/wp-content/uploads/2017/09/170817_crosstabs_Politico_v1_TB.pdf. This poll was conducted August 31 – September 3, 2017, with a sample of 1,993 registered voters nationwide.
[39] Monmouth University Poll, “National: Public Takes Softer Stance on Illegal Immigration,” https://www.monmouth.edu/polling-institute/reports/MonmouthPoll_US_092117/. This poll was conducted September 15 to 19, 2017, with a sample of 1,009 U.S. adults.
[40] Harvard Harris Poll. Key findings: http://harvardharrispoll.com/wp-content/uploads/2017/10/Harvard-Harris-Poll_September_Report_092517.pptx. Crosstabs: http://harvardharrispoll.com/wp-content/uploads/2017/09/HHP-September-Wave_Topline-Memo_Custom-Banners_Registered-Voters.pdf. This survey was conducted September 17 to 20, 2017, with a national sample of 2,177 registered voters.
[41] CNN September 2017, http://i2.cdn.turner.com/cnn/2017/images/09/27/cnnssrspoll.pdf. This nationwide survey of 1,053 adults was conducted September 17 to 20, 2017.
[42] Quinnipiac University, “Dreamers Should Stay, U.S. Voters Say 5-1 Quinnipiac University National Poll Finds; Voters Losing Hope For Peaceful Fix In North Korea,” https://poll.qu.edu/national/release-detail?ReleaseID=2488. This survey consisted of a sample of 1,412 registered voters nationwide and was conducted September 21 to 26, 2017.
[43] Quinnipiac University, “Dreamers Should Stay, U.S. Voters Say 5-1 Quinnipiac University National Poll Finds; Voters Losing Hope For Peaceful Fix In North Korea,” https://poll.qu.edu/national/release-detail?ReleaseID=2488. This survey consisted of a sample of 1,412 registered voters nationwide and was conducted September 21 to 26, 2017.
[44] Fox News Poll: “83 percent support pathway to citizenship for illegal immigrants,” http://www.foxnews.com/politics/2017/09/28/fox-news-poll-83-percent-support-pathway-to-citizenship-for-illegal-immigrants.html. This poll was conducted September 24 to 26 with a sample of 1,107 registered voters nationwide.
[45] Chicago Council on Global Affairs, “What Americans Think about America First,” https://www.thechicagocouncil.org/sites/default/files/ccgasurvey2017_what_americans_think_about_america_first.pdf. This survey was conducted June 27 to July 19, with a sample of 2,020 adults nationwide. The report was published in October.
[46] Chicago Council on Global Affairs, “What Americans Think about America First,” https://www.thechicagocouncil.org/sites/default/files/ccgasurvey2017_what_americans_think_about_america_first.pdf. This survey was conducted June 27 to July 19, with a sample of 2,020 adults nationwide. The report was published in October.
[47] CBS News, “Americans Frustrated with Congress,” August 3 – 6, 2017. https://www.scribd.com/document/355851193/Cbs-News-Poll-Toplines-Congress-Release-8-8-17. Sample: 1,111 adults nationwide. {Check to shorten this reference}
[48] NBC News/Wall Street Journal Survey, August 5 – 9. https://www.wsj.com/public/resources/documents/17312NBCWSJ2017SocialTrendsPoll09062017Release.pdf. Sample: 1,200 adults, nationwide, including 994 registered voters.
[49] Quinnipiac University, “86% of U.S. Voters Want to Negotiate with North Korea, Quinnipiac University National Poll Finds; But Most Not Confident Trump Can Handle It,” conducted August 9 – 15, with a sample of 1,361 registered voters. https://poll.qu.edu/national/release-detail?ReleaseID=2480.
[50] ABC News/Washington Post, “Americans Back DACA by a Huge Margin,” http://www.langerresearch.com/wp-content/uploads/1191a4DACAandImmigration.pdf. This poll was conducted September 18 to 21 with a sample of 1,002 adults nationwide.
[51] Harvard Harris Poll. Key findings: http://harvardharrispoll.com/wp-content/uploads/2017/10/Harvard-Harris-Poll_September_Report_092517.pptx. Crosstabs: http://harvardharrispoll.com/wp-content/uploads/2017/09/HHP-September-Wave_Topline-Memo_Custom-Banners_Registered-Voters.pdf. This survey was conducted September 17 to 20, 2017, with a national sample of 2,177 registered voters.
[52] CNN September 2017, http://i2.cdn.turner.com/cnn/2017/images/09/27/cnnssrspoll.pdf. This nationwide survey of 1,053 adults was conducted September 17 to 20, 2017.
[53] Politico/Morning Consult, “National Tracking Poll #171102” https://morningconsult.com/wp-content/uploads/2017/11/171102_crosstabs_POLITICO_v1_AP.pdf. This poll was conducted November 2 – 6, 2017, with a sample of 1,991 registered voters nationwide.