This is part three in a five-part series of short papers on the EB-5 Immigrant Investor Visa program. If you missed parts 1 and 2, you can find them here.
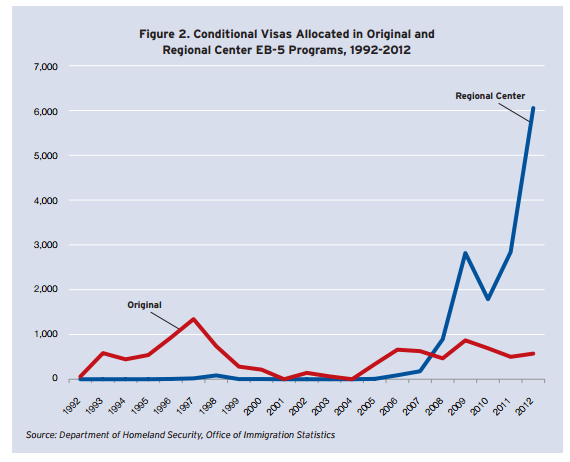
Demand for EB-5 visas is higher than ever. In 2007, the State Department issued about 800 EB-5 visas, and by 2012, that number had grown to about 7,600. In 2014, for the first time, the overall statutory EB-5 visa cap of 10,000 was met (counting investors and family members) worldwide. As Graph 3 indicates, the number of visas allocated in the Regional Center EB-5 Program jumped from fewer than 2,000 in 2010 to more than 7,300 in 2012, while the demand for the original EB-5 program has stayed almost constant since 1992, floating below 1,000 applications.
Regional centers appeal to immigrant investors who prefer to take a more passive role in managing their investments, allowing others to start or manage the investment project. This allows investors more flexibility to live and work in the United States away from the investment site. Additionally, by pooling investment from many investors into one larger project, it is easier for the project to create the mandated number of jobs — including indirect jobs.
Graph 3: Conditional Visas Allocated in Original and Regional Center EB-5 Programs, 1992-2012
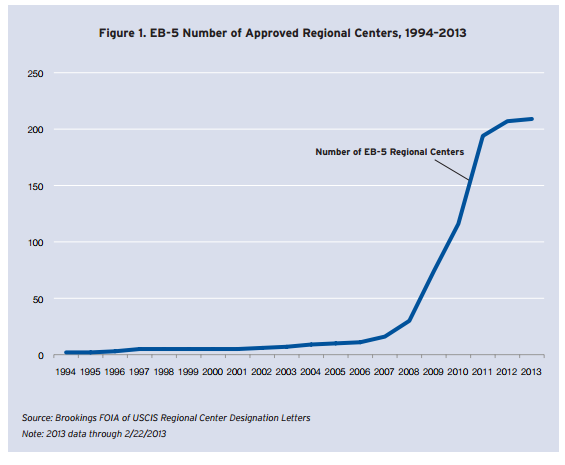
Additionally, as Graph 4 demonstrates, the number of regional centers increased from 16 in 2007 to 223 in 2013. This sharp increase in the number of regional centers has corresponded with the boost in demand for EB-5 visas.
Graph 4: EB-5 Number of Approved Regional Centers, 1994–2013
This trend has only intensified in the past decade. According to the USCIS website, the agency had approved about 915 regional centers as of July 15, 2015.
In recent years, EB-5 applicants from China have surged. In 2013, Chinese nationals accounted for 80 percent of total EB-5 visas issued, compared with 14 percent in 2007. In 2013, for the first time, China reached its annual EB-5 visa cap of 6,895. Only two years earlier, in 2011, fewer than 2,500 visas were issued to Chinese nationals. Through August 2014, China’s share of EB-5 visas rose even further, representing nearly 85 percent of all EB-5 visas issued. In August 2014 the State Department, for the first time in history, stopped issuing additional EB-5 visas to Chinese individuals until the beginning of the 2015 fiscal year because of the country cap. And there continues to be a backlog on EB-5 visas for Chinese nationals. As of August 2015, the Department of State was adjudicating visa applications for EB-5 petitions filed by Chinese nationals in September 2013.
Source for both graphs: Audrey Singer and Camille Galdes, “Improving the EB-5 Investor Visa Program: International Financing for U.S. Regional Economic Development”
Continue reading Part 4: EB-5 Immigrant Investor Program Criticisms
Full EB-5 Visa series available here.


