In the United States, there are a wide variety of visas – both immigrant and nonimmigrant – that foreign nationals can apply for to enter the country. Most categories of visas, apart from tourist visas, have a maximum number that can be issued each fiscal year. This is referred to as a visa or immigration “cap.”
Although there are roughly a million immigrant visas issued each year and hundreds of thousands of nonimmigrant visas, the immigration cap system has resulted in long wait times for those attempting to come to the U.S.
Where did the Immigration Cap Come From?
Today, most visa categories to the U.S. are capped. For example, there are 65,000 H-1B visas in the “regular cap” available each fiscal year for those who want to temporarily enter the U.S. to work in a specialty occupation. The current U.S immigration system, which emphasizes visas for family and employment categories, is fairly new. Until the 1965, it was national origin that was capped, meaning that the U.S. would only issue a certain number of visas to foreign nationals from each country. Each country had a different maximum number, but once that number was reached, no more people from that country would generally issued a visa that year. As such, this system was called the “national origin quota system.”
Early History
The national origin quota system can be traced back to 1882 and the implementation of the Chinese Exclusion Act. This legislation imposed a ten-year ban on immigration to the U.S. for Chinese immigrants. The Chinese Exclusion Act was set to expire in 1892, but it was renewed by the Geary Act for another ten years. Once the extension expired, the ban was made permanent. The ban was only repealed in 1943, when China became a member of the Allied Powers in World War II. The Chinese Exclusion Act was the first time in American History that the government specifically excluded people from a certain nation.
This system evolved further with the passing of the Emergency Quota Act of 1921. This bill was passed in anticipation of post-war reconstruction, as Europe was in shambles and nearly four million soldiers had just been demobilized. This bill established a cap on admissions from any country in the Eastern Hemisphere (Europe, Africa, and Asia) to 3 percent of the number of residents from that country already living in the U.S. in the 1910 census. This approach resulted in Northern and Western European countries having a higher quota, while those from Eastern or Southern Europe or from other non-European countries in the Eastern Hemisphere had a lower quota. No limits were set on immigration from Canada, Mexico, and other Western Hemisphere countries. The new law set a cap on the number of admissions equal to roughly 358,000 from the Eastern Hemisphere. It also gave federal agencies the power to decide which immigrants to admit and deny entry to, so long as that person was not specifically and explicitly approved by other legislation.
The national origin quota system was officially born with the Immigration Act of 1924, also called the National Origins Act. This legislation reduced the total number of visas available from roughly 358,000 to 164,000 and established per country cap allocations. Under the allocations of the Immigration Act of 1924, 82 percent of all available visas went to Western and Northern European Countries, 14 percent went to Eastern and Southern European countries, and a small 4 percent went to the remaining Eastern Hemisphere (Asia and Africa) countries. Again, there were no caps for North and South American countries. This resulted in spikes in immigration from Canada, Mexico, and Central and South America.
The 1921 and 1924 Acts were popular at the time because they perpetuated notions of eugenics, nationalism, and xenophobia. They promoted the immigration of Western and Northern Europeans by making it easier for them to immigrate legally to the U.S. This, rather than increasing Western and Northern European migration, dramatically reduced the number of immigrants that came to the U.S. Up until the 1920s, Asians, Southern Europeans, and Eastern Europeans constituted a large percentage of immigrants. When the number of visas available to these groups was severely limited, the total number of immigrants to the U.S. fell rapidly. In 1919 the U.S. saw 554,920 immigrants, but by 1932 – only 13 years later – the number was down to 35,576 immigrants.
It was not until the late 1930s that the national origin system and the Immigration Act of 1924 started receiving widespread reconsideration. The national origin quota system gave no exception to the caps for refugees, which caused problems when Adolf Hitler rose to power and created a refugee crisis in Europe. This all came to a head with two incidents in 1939. First, Congress defeated a proposal that would have facilitated the migration of 20,000 children from Nazi Germany, even though all of the children already had family sponsors in the U.S. Senator Robert Reynolds (D-NC) led the opposition, arguing that the admission of refugees, even child refugees, would increase unemployment. Second, the U.S. government denied 900 Jewish refugees – on the St. Louis – entry into the U.S., stating that the country caps for Eastern Europe had already been filled. Officials sent the boat back, which resulted in the deaths of 254 of the 900 passengers in the Holocaust.
These incidents and the shame they caused facilitated the passing of the Displaced Persons Act of 1948 and the Refugee Relief Act of 1953, both of which helped facilitate post-war refugee immigration. These bills, together, were temporary and authorized the admission of about 415,00 displaced persons and refugees into the U.S.
Immigration Reform of the 1950s
The post-war era saw many immigration reforms. During World War II, the United States saw a lack of able-bodied men and needed laborers to maintain the food supply. Congress created the Bracero Program, which – extended until 1964 – facilitated the legal entry of about 4.5 million Mexican agricultural workers during the 22 years it was in place.
The expansion of immigration began with the passing of the Immigration and Nationality Act (INA) in 1952. The INA effectively increased the quota for Europeans in Eastern and Southern Europe, set a minimum quota for 100 visas for immigrants from every recognized country, and removed all bans still in place that banned Asian immigration (mostly symbolic since Japan was the highest number at 185 per year).
The INA of 1952 also introduced four preference categories, meaning that the allotted number of visas each country received had to be used for certain categories of people before they could be used for others. Fifty percent of visas had to go to immigrants with needed workforce skills, 30 percents to parents of adult U.S. citizens, and 20 percent to the spouses and children of legal permanent residents (LPRs). Any unused green cards went to the siblings and adult children of U.S. citizens. This process was conducted similarly to how green card roll over happens today. Any unused visas from the immigrants with needed skills, parents of adult U.S. citizens, and the spouses and children of LPRs would be distributed to the other immigrants. For example, if in fiscal year 1957 for Belgium there were 42 immigrants with needed skills, 28 parents of adult U.S. citizens, and 9 spouses/children of LPRs, the left over 21 green cards would be allowed to be given to other Belgians that did not fit into these categories in fiscal year 1958.
In 1965, amendments to the INA were passed that replaced the national origin quota system with a preference system. This act saw immigrants broken up into seven preference categories, with each category receiving a certain percentage of all available visas. The preference categories were, in this order: (1) unmarried adult children of U.S. citizens, (2) spouses and unmarried children of LPRs, (3) members of the professions, scientists, and artists of exceptional ability, (4) married children of U.S. citizens, (5) siblings of U.S. citizens, (6) skilled and unskilled workers in occupations for which there is insufficient labor supply, and (7) refugees given conditional entry (not visas), i.e, from Communist countries or the Middle East.
This evolution did not completely eradicate quotas, as it left hemispheric quotas intact. Under this Act, there were 120,000 visas available to immigrants from the Western Hemisphere and 170,000 visas available to immigrants from the Eastern Hemisphere, and there were only up to 20,000 visas available to individuals from each Eastern Hemispheric country.
Immigration Reform in the 1990s and Early 2000s
In 1990, another immigration act was passed that increased the total number of visas available to 675,000 per year – 480,000 for family-reunification visas and 140,000 for employment visas. It also created and allotted 55,000 total visas to the diversity visa program, which makes a limited number of green cards available to perspective immigrants from nations that have seen less than 50,000 emigrants to the United States in the past five years. Originally, this was a means to promote Western European migration, as they were the group with least immigrants, but has become more equitable over time. Immediate relatives – spouses, parents, and children under 21 – of U.S. citizens were placed completely outside the cap and remain there today. There is no visa cap for them to immigrate to the U.S.
At the turn of the millennium, several immigration reforms were passed in rapid succession. In 2000, the American Competitiveness in the Twenty-First Century Act was passed, which temporarily raised the annual H-1B visa cap and permanently exempted universities and nonprofit research institutions from the H-1B cap. Next passed was the H-1B Visa Reform Act of 2004, which provided 20,000 additional H-1B visas to high-skilled temporary workers with advanced degrees from American Universities.
No substantive reform has been made to the immigration system since the early 1990s. As no updates were made to the green card cap in the immigration acts of the early 2000s, the United States still currently operates under the cap prescribed in 1990 – 675,000. This number has been left intact since 1990 – over 30 years – and has not been updated to reflect today’s immigration needs.
What do Immigration Caps Look Like Today?
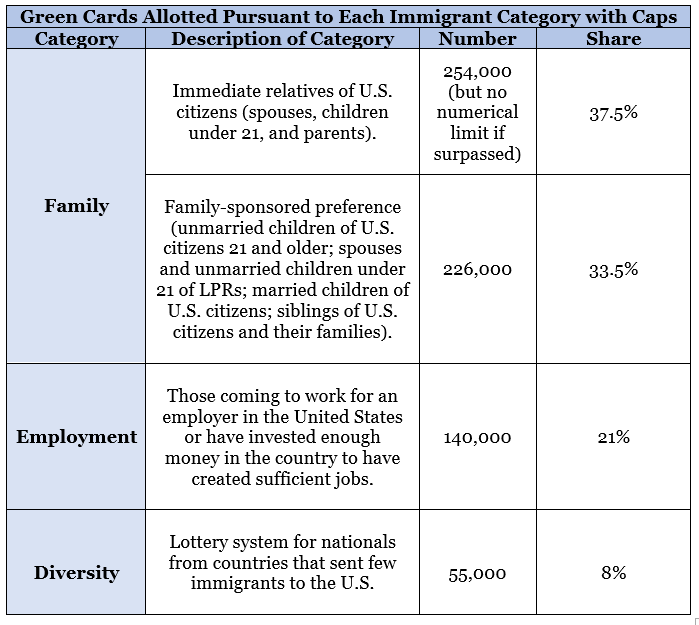
While the national origin quota system officially ended in 1965, hints of it can still be seen throughout our immigration system today. There are roughly one million green cards issued annually. Of these, the majority are issued to the immediate relatives of U.S. citizens. Immediate relatives– spouses, parents, and unmarried children under the age of 21 – are exempt from quotas. Therefore, there is no limit to the number of these green cards that can be issued each year. The rest are issued to immigrants in the preference categories.
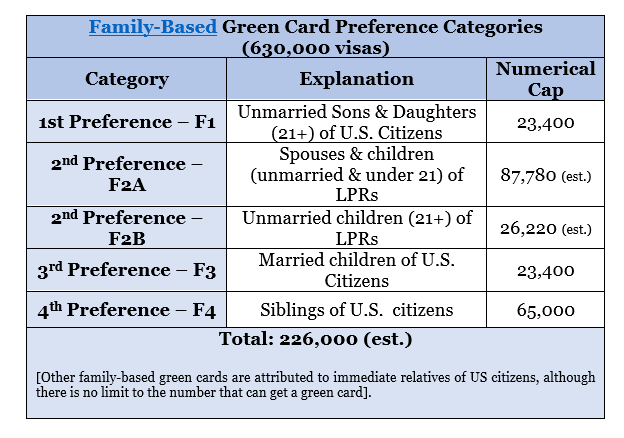
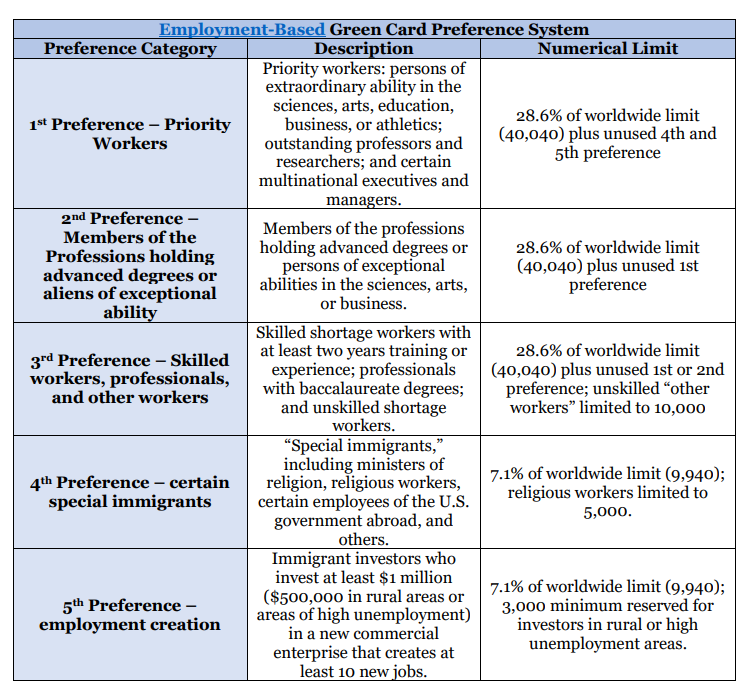
In the modern immigration system, immigrants are broken up into categories – called preference categories – with each category allocated a fixed number of the available green cards. USCIS uses the preference system to prioritize (and grant more available green cards) to the family members of U.S. citizens and LPRs and highly skilled individuals sponsored by employers. Accordingly, the categories are broken up into two subsets – family-based immigrants and employment-based immigrants. Each subset contains preference categories.
The preference category system interacts with the remnants of the old quota system. Per the Immigration Act of 1990, each country is allotted 7 percent of the available green cards for both family-based and employment-based immigrants. This means that every country has a maximum number of 44,100 family-based immigrants and 14,700 employment-based immigrants for each fiscal year.
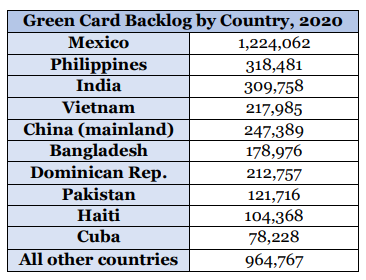
In practice, this results in the Marshall Islands, with a population of 42,000 people, and India, with a population of 1.4 billion, having the same number of allocated green cards. This leaves some countries – the ones with a large number of people who want to immigrate to the U.S., such as Mexico, China, and India – with enormous backlogs. Many more people from those countries want to immigrate to the U.S. than the 675,000 green cards available based on the current preference category system.
In addition to the categories mentioned above, the president sets an annual ceiling for refugee arrivals. The U.S. also admits asylum seekers, and there are no caps for asylum applications. There are other small categories of green cards to respond to particular situations or because it is in the national interest, which also do not have a cap. Within the family and employment categories, the quotas are broken down further by preference category and country of birth.
The Department of State issues a monthly visa bulletin that tracks green card availability for each category. The Department of State and DHS collaborate to determine when people in each category and from different countries are eligible for a green card. This is done through priority dates. The priority date is the day in which the completed green card application was received by USCIS. When a person’s priority date appears in conjunction with their country, a green card is available to them. The priority date for each category adjusts every month, moving either forwards or backwards, in response to the number of people that claimed a green card. These are published monthly in a visa bulletin by the State Department.
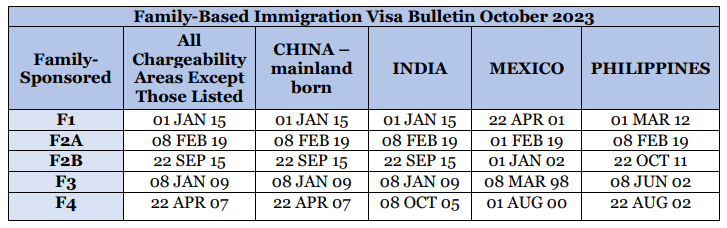
To read this, one must look at the category by which one is immigrating, then move sideways to country of origin to see the applicable priority date. For example, in October’s family-based visa bulletin, there were green cards available for immigrants from Philippines in the F3 family category whose priority date – the date USCIS received their completed application – was on or before June 8, 2002.
How do Immigration Quotas/Caps Affect Legal and Illegal Immigration to the United States?
U.S. Immigration law imposes a limit on how many immigrants from any particular country can receive green cards in a given year. As demonstrated by the October 2023 visa bulletin, the U.S. immigration system is suffering from impressive levels of backlogs. Some people must wait upwards of 25 years from the time they submitted their application to the time that a green card became available to them.[1]
These immigration caps can altogether eliminate an immigrant’s opportunity to move to the U.S., as the delay can cause them to remain separated from family, lose job opportunities, and miss chances to enroll in educational institutions. It might also drive individuals to come to the U.S. without documentation, since people who would have otherwise immigrated legally face a substantial and unrealistic backlog.
Why do Immigration Quotas/Caps Matter?
Immigration Quotas can make the backlog worse.
Immigration quotas can exacerbate immigration visa backlogs. Only a fixed number of people in each category and from each country – mainly India, China, and Mexico, but it can change – are able to obtain green cards each year. The excess carries over into the next year, meaning there are less green cards available to the people applying that year. The applicants that did not receive green cards get pushed into the waiting pool for the next year and so on, so that number of people waiting in the queue continuously expands. This has created a backlog so enormous that immigrants and their families can wait decades for green cards.
The backlog caused by quotas has a negative effect on the economy.
Workers with employment visas who apply for a green card have a restricted ability to work and travel. They must continue to renew their temporary status until a green card is available, which makes changing jobs or receiving a promotion exceedingly difficult. The complicated process and the fact some workers will have to wait many years for a green card have led to many skilled workers deciding against coming to the United States, detracting from the country’s competitiveness.
This is actively hurting the U.S. economy, as studies have shown that restrictions on highly-skilled immigration pushes companies to move jobs offshore. A recent survey of individuals waiting in U.S. immigration backlogs – either for their first visa or to adjust status from a temporary visa to a green card – showed that 32 percent of prospective immigrants were seriously considering returning to their country of origin, and 70 percent were considering moving to a more hospitable country. If even a fraction of these people were to do so, it could have devastating effects on America’s labor force, and thus, the economy.
Backlogs caused by quotas disincentives legal immigration.
The backlogs caused by the quotas make legal immigration difficult and complicated. While people wait, they miss out on promotions (because many require visa changes), may remain separated from family, miss chances to enroll in education institutions, and may be forced to return to their original country if they lose their jobs. This has resulted in people deciding against legal immigration, instead moving to other countries or finding the risks of unlawful immigration more palatable than waiting a decade or more in the backlog.
Immigration quotas and subsequent backlog create a category of immigrant children that lose status while waiting for a visa.
Documented Dreamers are those who came to the U.S. with their parents on a temporary nonimmigrant visa, whose parents are subsequently pursuing a green card. Children who enter the country under a temporary, nonimmigrant visa with their parents are only eligible to obtain permanent resident status if their parent do so before they turn 21. At age 21, if their parent’s green card application has not yet been approved, they age out of their dependent status and are removed from the green card queue entirely. They may later apply through the F2B or F1 preference categories (if unmarried) once their parents obtain permanent status or U.S. citizenship. Meanwhile, they are at risk of deportation from the U.S., despite many of them feeling like the U.S. is their only home. There are an estimated 200,000 Documented Dreamers in the U.S. and the population is likely to keep growing.
Conclusion
The U.S. immigration system has changed drastically since its origin in the 19th century. However, remnants of the national origin quota system remain, as seen by the fact that each country is allocated a maximum of 7 percent of available green cards in each preference category each fiscal year. This system has caused significant backlogs, especially for countries with a large number of people wishing to immigrate legally to the U.S. The current system can keep families separated, negatively impact the economy, and disincentivize legal immigration. Congress should consider updating the legal immigration quota/cap system to better reflect today’s family and economic needs, either through additional visas or a more streamlined process.
.
The National Immigration Forum would like to thank Jordan Ennis, Policy and Advocacy Intern, for developing this explainer.
[1] See Mexico, F3. Priority Date: Mar. 8, 1998. Bulletin date: October 2023. Elapsed time: 25 years, 7 months.