EB-1 Visa Category (First Preference)
EB-2 Visa Category (Second Preference)
EB-3 Visa Category (Third Preference)
EB-4 Visa Category (Fourth Preference)
EB-5 Visa Category (Immigrant Investor Program)
1. EB-1 Visa Category (First Preference)
About 40,000 visas are allocated to the first-preference immigrant workers and their immediate families. EB-1 visa holders are individuals with extraordinary abilities in sciences, arts, education, business, or athletics; outstanding professors or researchers with international recognition; and multinational executives or managers.
Chart 1 shows the total number of EB-1 visas issued each fiscal year (FY) from 2007 to 2017.
Chart 1. Total EB-1 Visa Issued, FY 2007-2017
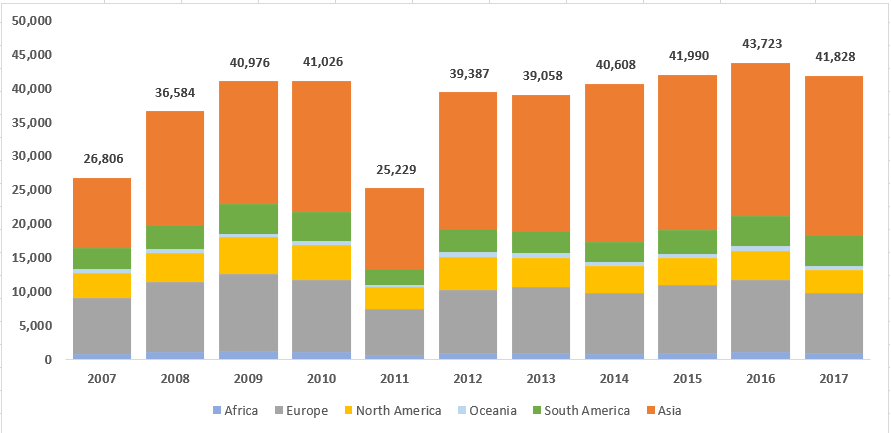
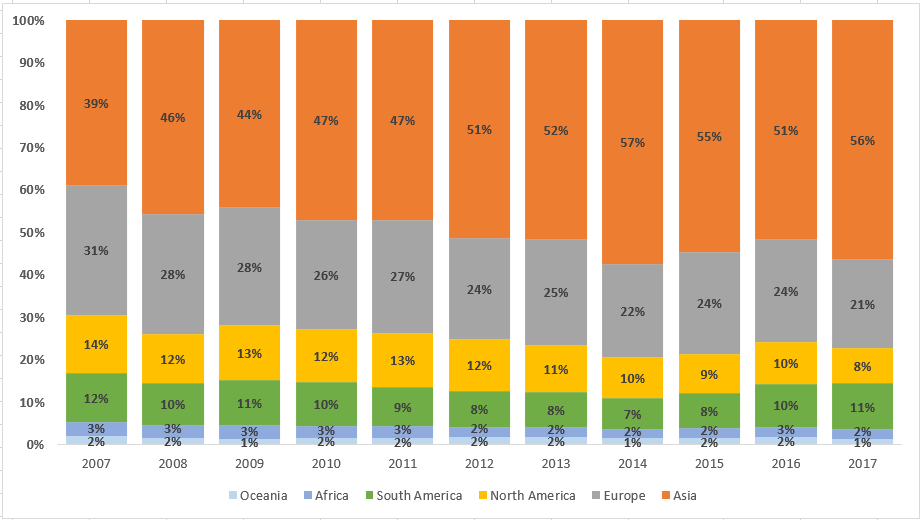
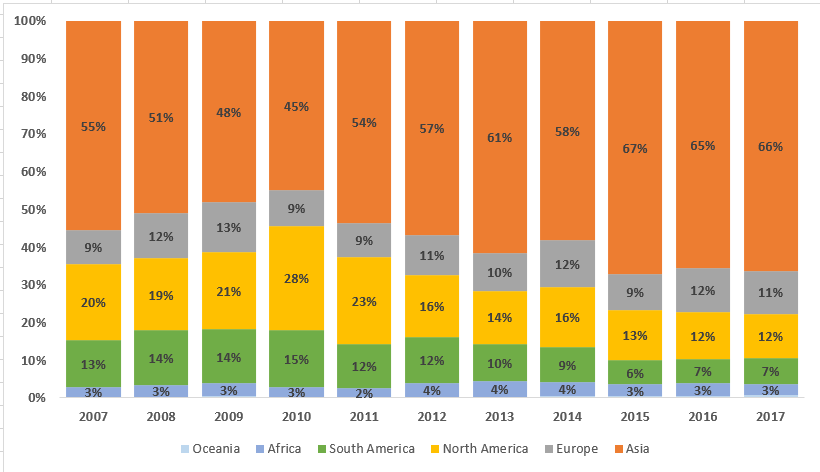
Chart 2 shows the percentage of EB-1 visas issued to immigrants from each world region from FY 2007 to FY 2017.
Chart 2. Total EB-1 Visa Issued (%), FY 2007-2017
2. EB-2 Visa Category (Second Preference)
About 40,000 visas are allocated to the second-preference immigrant workers and their immediate families. EB-2 visa holders are individuals with an advanced degree or its equivalent, or have exceptional ability in the sciences, arts, or business.
Chart 3 shows the total number of EB-2 visas issued each fiscal year from 2007 to 2017.
Chart 3. Total EB-2 Visa Issued, FY 2007-2017
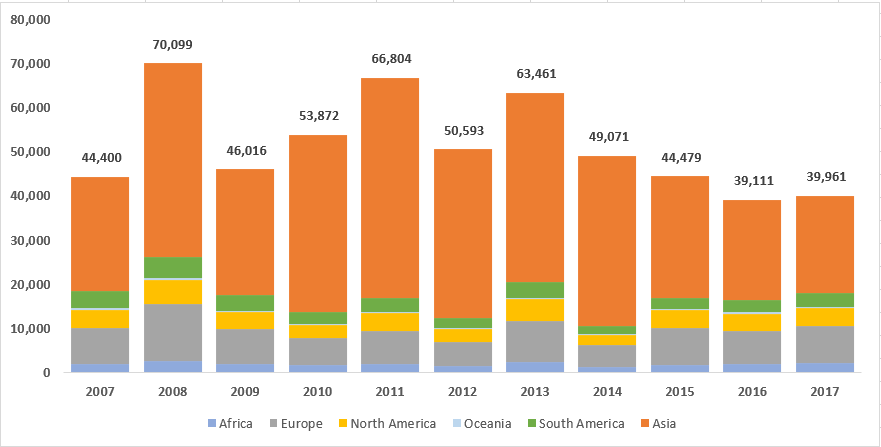
Chart 4 shows the percentage of EB-2 visas issued to immigrants from each world region from FY 2007 to FY 2017.
Chart 4. Total EB-2 Visa Issued (%), FY 2007-2017*
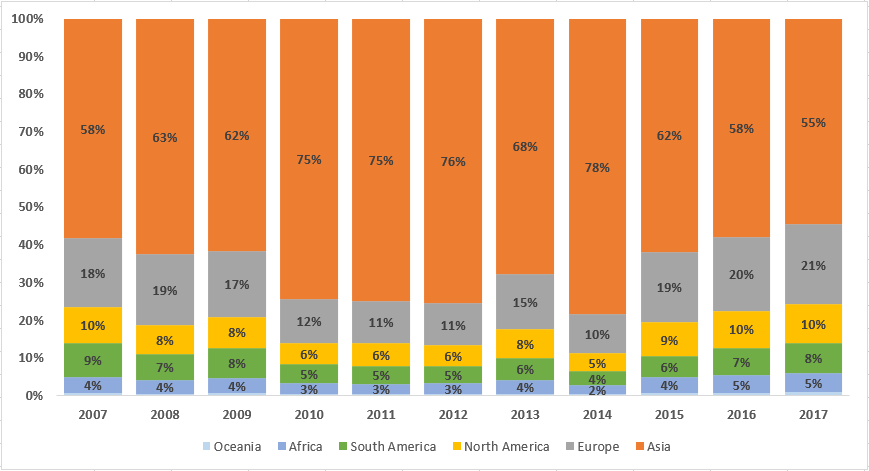
*Less than 1% of EB-2 visas were issued to individuals from Oceania between FY 2007 and FY 2017.
3. EB-3 Visa Category (Third Preference)
About 40,000 visas are allocated to the third-preference immigrant workers and their immediate families. EB-3 visa holders are issued to “skilled workers” whose jobs require a minimum of two years of training or full-time work experience; “professionals” whose jobs require at least a U.S. baccalaureate degree or a foreign equivalent; and “other workers” performing unskilled labor that requires less than two years of training or full-time experience. Employers who want to petition for EB-3 visas workers must show a lack of qualified workers in the U.S. for those positions.
Chart 5 shows the total number of EB-3 visas issued each fiscal year from 2007 to 2017.
Chart 5. Total EB-3 Visa Issued, FY 2007-2017
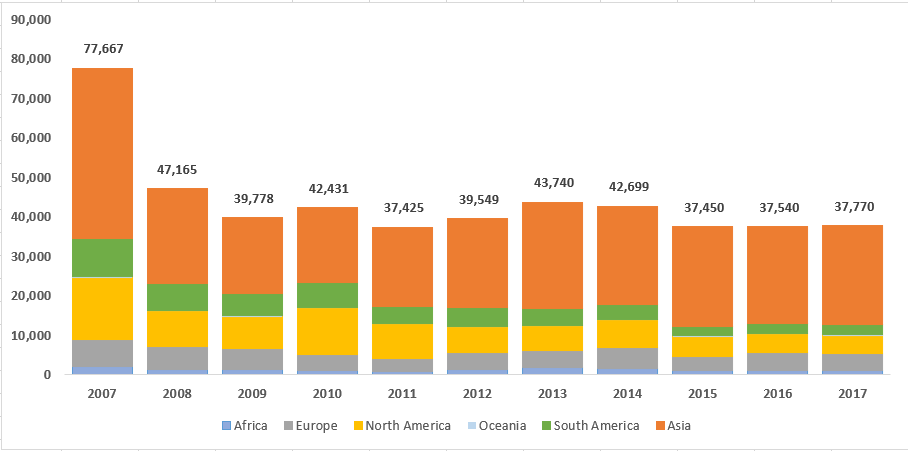
Chart 6 shows the percentage of EB-3 visas issued to immigrants from each world region from FY 2007 to FY 2017.
Chart 6. Total EB-3 Visa Issued (%), FY 2007-2017*
*Less than 1% of EB-3 visas were issued to individuals from Oceania between FY 2007 and FY 2017.
4. EB-4 Visa Category (Fourth Preference)
About 10,000 visas are allocated to the fourth-preference immigrant workers and their immediate families. EB-4 visa holders are religious workers, special immigrant juveniles, broadcasters for Broadcasting Bureau of the United States Broadcasting Board of Governors (BBG), G-4 international organization or NATO-6 employees, international employees of the U.S. government abroad, armed forces members, Panama Canal zone employees, certain kind of physicians, Afghan and Iraqi translators, and Afghan and Iraqi nationals who have provided faith service in support of U.S. operations.
Chart 7 shows the total number of EB-4 visas issued each fiscal year from 2007 to 2017.
Chart 7. Total EB-4 Visa Issued, FY 2007-2017
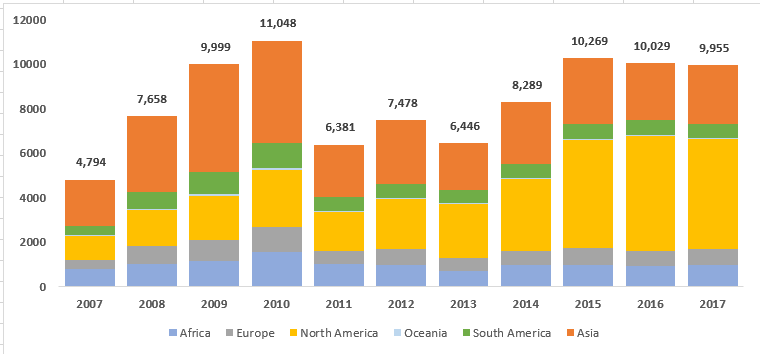
Chart 8 shows the percentage of EB-4 visas issued to immigrants from each world region from FY 2007 to FY 2017.
Chart 8. Total EB-4 Visa Issued (%), FY 2007-2017*
*Less than 1% of EB-4 visas were issued to individuals from Oceania between FY 2007 and FY 2017.
5. EB-5 Visa Category (Immigrant Investor Program)
About 10,000 visas are allocated to the fifth-preference category, which is for immigrants who make a $500,000 or $1 million investment (depending on location) in a commercial enterprise in the United States and plan to create or preserve 10 permanent full-time jobs for qualified U.S. workers.
Chart 9 shows the total number of EB-5 visas issued each fiscal year from 2007 to 2017.
Chart 9. Total EB-5 Visa Issued, FY 2007-2017
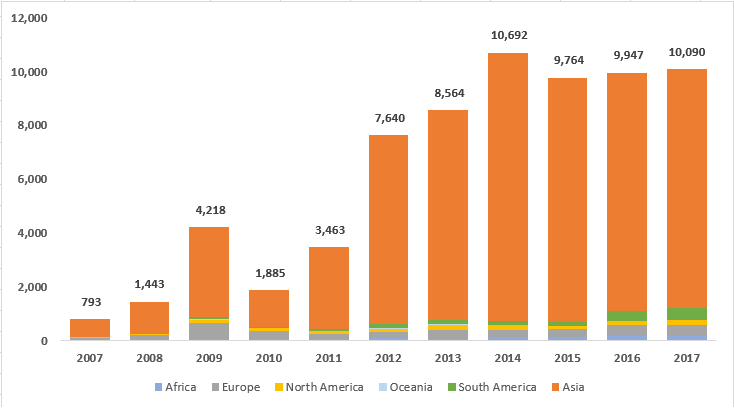
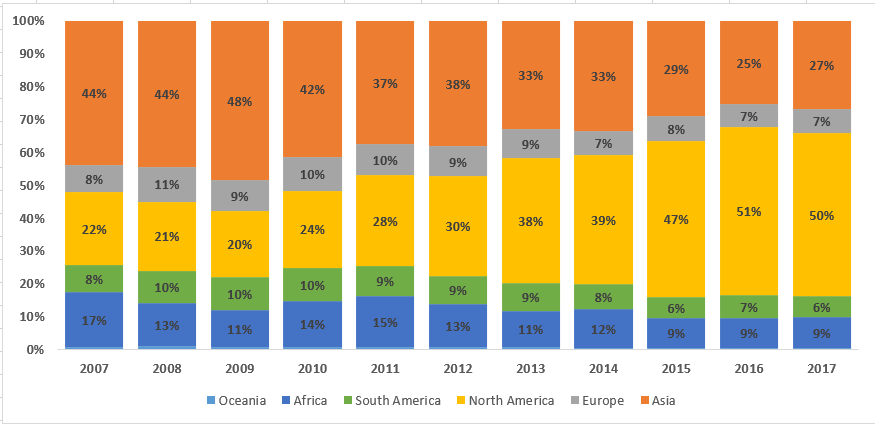
Chart 10 shows the percentage of EB-5 visas issued to immigrants from each world region from FY 2007 to FY 2017.
Chart 10. Total EB-5 Visa Issued (%), FY 2007-2017
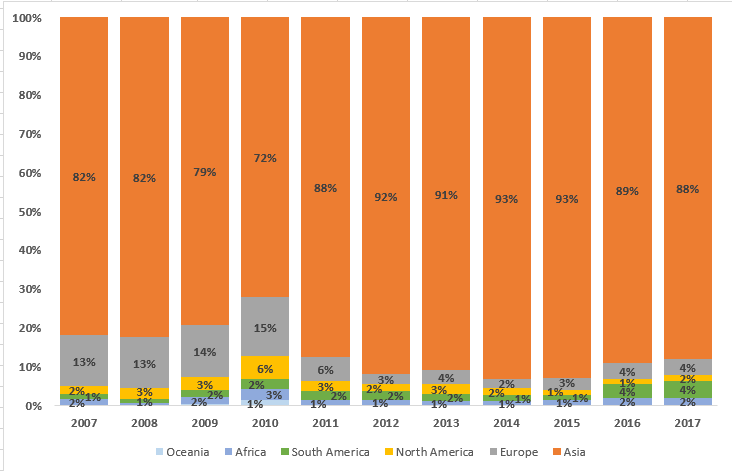
*Except for 2010, less than 1% of EB-5 visas were issued to individuals from Oceania between FY 2007 and FY 2017.