Introduction
This paper looks at the increase in U.S. refugee resettlement from Latin America and the Caribbean following the COVID-19 pandemic.
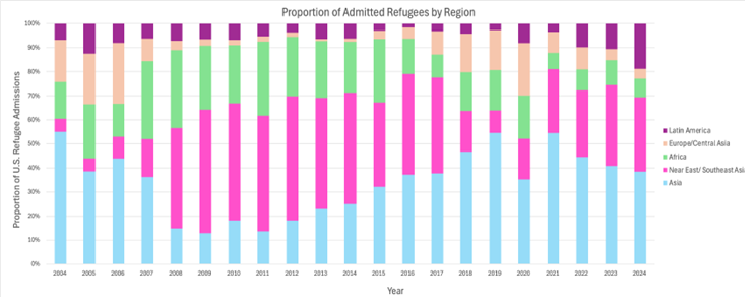
Since the beginning of the U.S. Refugee Program in 1980, the regional distribution of refugees has fluctuated, as illustrated in Figure 1. The U.S. Presidential Determination historically establishes an overall refugee ceiling for the fiscal year and then breaks down that ceiling into five regions: Africa, East Asia (Asia), Europe and Central Asia, Latin America/Caribbean, and the Near East/South Asia. Each region has its own regional ceiling and combined they make up the overall refugee ceiling.
Until the onset of the COVID-19 pandemic, Latin America and the Caribbean (referred hereinafter, in this paper, as “Latin America”), has had the least fluctuation compared to other regions, and the lowest number of overall resettled refugees. In the last 20 years, Latin American refugees have not exceeded 10% of the annual U.S. refugee admissions with the exception of fiscal year (FY) 2005 (12.45%) and more recently in FY2023 (10.52%) and FY2024 (25.35%) .
Figure 1: Proportion of Admitted Refugees to the U.S. Refugee Program by Region

As encounters at the U.S.-Mexico border reached an all-time high in early FY2024, addressing asylum and refugee populations from Latin America has become a critical subject because the fate of millions of lives are at stake.
This paper will focus on patterns and notable changes in the refugee populations coming out of Latin America and the impact on encounters at the U.S. Southern Border.
Policy Under the Refugee Act: 1980 – 2021
Congress passed the Refugee Act of 1980 following the influx of Vietnamese and Cambodian refugees from the Vietnam War. The Refugee Act provided the first statutory basis for asylum and adopted the United Nations’ definition of “refugee.” Most importantly, Congress removed all geographical or ideological requirements for refugee status. The Refugee Act of 1980 allowed the President to set yearly limits on the number of refugees admitted, and to allocate how many are admitted from each region. Since enacting the Refugee Act of 1980, the U.S. has admitted more than 3.7 million refugees from all around the world. Of those millions of refugees, only about 152,000 refugees were admitted from Latin America, representing simply 4.2% of all the refugees resettled into the U.S. since 1980.
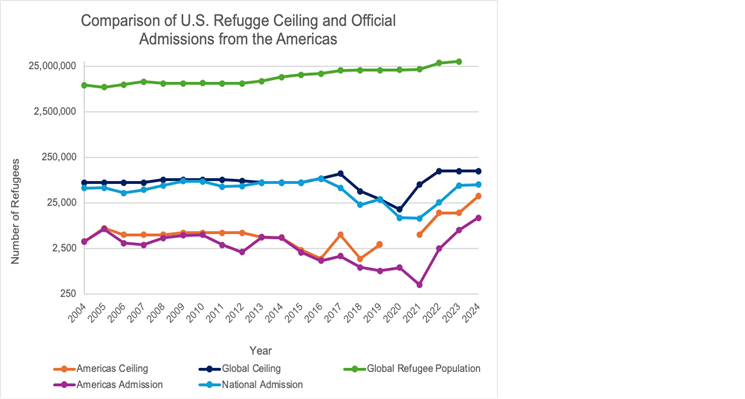
Figure 2 below, which is built on a logarithmic scale due to the significant size difference between the represented categories and plots the increase in refugees by increments with a ten-fold increase for each of the different refugee categories, highlights these trends. Between FY2004 and FY2021, refugee admissions from the Latin America only increased noticeably in 2005 with 6,699 refugee arrivals, reaching 12.45% of the overall arrivals that fiscal year. Of the 6,699 refugees resettled to the U.S. in FY2005, 6,360 were from Cuba, an increase largely due to the U.S. exerting greater pressure on the Cuban government.

Figure 2: Comparison of U.S. Refugee Admissions Trends with Global Refugee Populations. The graph plots the number of refugees on a logarithmic scale. The 2020 gap in “Americas Ceiling” is attributed to ceilings being based on admission category instead of by regions.
Between FY2016 to FY2021, there was a steep decline in refugee admissions from Latin America. This drop started with the first Trump administration dramatically lowering the presidential determination for U.S. refugee admissions. It is worth noting that these decreases occurred simultaneously with significant increases in global displacement.
In response to COVID-19 pandemic restrictions, refugee admissions from Latin America in FY2021 reached the lowest levels in two decades, falling to only 400 refugee arrivals. In response to the pandemic, governments, worldwide implemented steps to limit the spread of the virus throughout 2020 and much of 2021, including restrictions on migration. Several governments in Latin America imposed mandatory lockdowns, entry bans, and border closures. As a result, cross-border mobility was significantly restricted.
The social isolation restrictions of that period increased unemployment, which exacerbated the vulnerability of populations in certain countries in Latin America. The pandemic affected countries’ labor markets, wages, and access to social protection measures, leading to increased displacement after the restrictions were relaxed. Additionally, migrant workers in third countries were especially vulnerable because they were among the first groups experiencing layoffs or wage reductions. This in turn, led to other vulnerabilities for migrant workers, including some who ended up being trafficked or otherwise exploited.
Post-Covid Admissions Increase: 2022 – 2024
The adverse conditions caused by the pandemic created a noticeable migration movement in 2022 as governments loosened their restrictions. Refugee admissions from the Latin America rebounded in FY2022 (2,485) and increased further in FY2023 (6,312), reaching more than 10% (10.52%) of the overall arrivals for the first time since FY2005.
For Latin America, and as points of comparison, the regional ceiling was 5,000 refugees in FY2021, 15,000 in FY2022 and FY2023, and a range of 35,000 to 50,000 in FY2024. That represented a significant increase in the Latin America refugee ceiling, a 10-fold increase in just four years.
This change was the start of a rapid upward trend, with FY2024 reaching an all-time high of refugees from the Latin America with 25,358 arrivals, representing more than a quarter of the overall arrivals for FY2024.
This uptick in refugees from Latin America was due in part to instability in multiple countries, including the largest-ever displacement of refugees in Latin America from Venezuela, amounting to nearly 8 million people according to UNHCR. Of the 25,358 Latin American refugees resettled to the U.S. in FY2024, more than half (12,875), were from Venezuela.
The small number of refugees resettled from Latin America, in comparison to the overall number of displaced persons, in part reflects U.S. refugee resettlement limitations. The FY2024 admissions from Latin American to the U.S. surpassed any previous numbers since the Refugee Processing Center (RPC) started collecting data in FY2001, and possibly represents the highest number of resettled refugees from Latin America since the beginning of the U.S. Refugee Program in 1980.
Other Factors Affecting Latin American Refugee Population Growth
According to the United Nations High Commissioner for Refugees (UNCHR), the Americas are home to 19% of the world’s forcibly displaced and stateless population. It is expected that 25 million people in the Americas will be forcibly displaced or stateless in 2024 (see Figure 2). More specifically, more than three quarters (83.57%) of admitted refugees from Latin America to the U.S. in FY2024, have come from three countries, Venezuela (12,875), Guatemala (5,017), and Nicaragua (3,299). Vulnerable populations in these countries have faced precarious conditions that were exacerbated by the pandemic and other factors.
A. Venezuela
According to the United Nations Refugee Agency, the Venezuelan exodus is one of the world’s largest refugee crises in the 21st century. Since 2015, millions of Venezuelans (representing a quarter of Venezuela’s population) have emigrated due to political and economic turmoil. Many countries have hosted Venezuelans, led by Columbia (2.9 million) and Peru (1.5 million).
Between 2014 and 2016, sudden drops in global oil prices undermined the Venezuelan economy and caused political instability. President Nicolás Maduro responded by consolidating political power through censorship and repression, which resulted in U.S. sanctions on the state-owned oil company, Petróleos de Venezuela (PDVSA). Despite having the largest oil reserves in the world, Venezuelans continue to face the repercussions of their oil industry’s struggles and Maduro’s repression.
In July 2024 after Maduro claimed victory in disputed elections, in which there was “overwhelming evidence” that the opposition won, more Venezuelans choose to leave the country, many travelling northward through the Darien Gap.
B. Guatemala
Economic instability and political corruption are the main driving factors for vulnerable populations out of Guatemala. Guatemala has one of the highest food insecurity and malnutrition rates in Latin America, with nearly 1 million impacted Guatemalans. Drought caused by climate change devastated farmers across the country. Most migrants coming from highly impacted regions cited “no food” as their reason for leaving.
In June 2023, Guatemala entered into an agreement with the United States to participate in the Safe Mobility Initiative. This initiative establishes Safe Mobility Office (SMOs) in countries to provide services to individuals in order to establish safe and orderly migration practices.
In July 2024, the United Nations Human Rights Chief, Volker Turk, visited Guatemala and issued a statement of ongoing concerns, highlighting corruption, gender inequality, and racism.
Guatemalans have migrated in the highest numbers to the U.S and Mexico. In FY2024, there were 195,000 encounters with Guatemalans at the U.S.-Mexico border down from a high of over 250,000 in FY2021, but still significant. Home to the youngest population in Latin America, young Guatemalans are impacted by the lack of job opportunities. Moreover, allegations of rampant corruption have increased instability in the country.
C. Nicaragua
In FY2022, Nicaraguan encounters at the U.S. southern border reached an all-time high of 164,600. While the number of border encounters declined in FY2024 to 91,049 . Nicaraguans have continued to migrate to the U.S. in large numbers to escape the political and economic instability. Since 2018, over 300,000 Nicaraguans have sought asylum; mostly in Costa Rica (which is currently hosting between 80,000 and 100,000 Guatemalan asylum seekers), but also in the U.S.
Nicaragua is led by President Daniel Ortega, who consolidated power after becoming president a second time in 2007 and carried out a series of repressive actions that garnered broad condemnation, including U.S. sanctions on state-run gold mines, which produced Nicaragua’s largest export. Moreover, Nicaragua faced several catastrophes in 2020 including the COVID-19 pandemic and Hurricanes Eta and Iota.
In January of 2023, two of the three countries outlined above, Nicaragua and Venezuela, were included in a new parole program introduced by the Biden administration for four countries-Cuba, Haiti, Nicaragua and Venezuela (CHNV) to address the large number of immigrants coming to the U.S.-Mexico border from these countries. While demonstrating success in reducing irregular migration, the CHNV program has faced legal challenges and is expected to be terminated by the incoming Trump administration in early 2025.
Global Refugee Population Growth
Increased migration from Latin America also reflects a larger global trend. It is estimated that there were some 65 million people displaced during World War II. Today, there is an estimated 120 million to 130 million displaced people worldwide. During and following WWII, a number of noteworthy institutions and non-profit organizations were established to address the global displacement, including UNHCR.
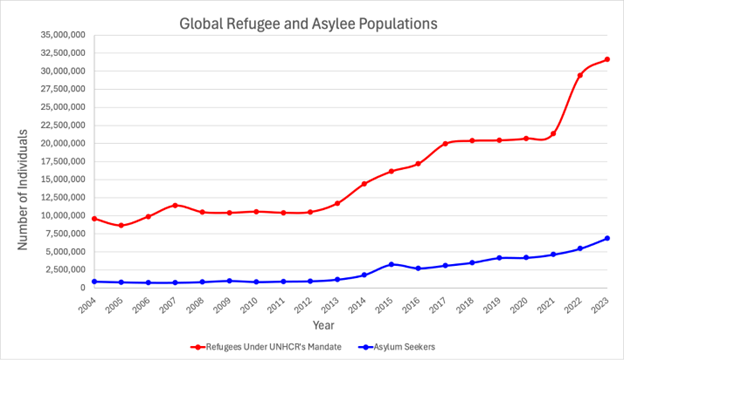
UNHCR recently reported that, as of the end of 2023, the world refugee population has more than tripled in the last ten years. The global refugee population grew by 7% alone in 2023, reaching 43.4 million, with forced displacement reaching the highest annual growth ever measured. As shown in Figure 3 below, between 2004 and 2013 the global refugee population remained relatively stable at a level below 12.5 million. Over the next decade, it increased significantly, exceeding over thirty million by the end of 2023.

Figure 3: Global Refugee and Asylee Populations. Both refugees and asylum seekers flee their countries for fear of persecution. However, refugees obtain their status through UNHCR, while asylum seekers apply directly within the host country. Data is based on fiscal year.
And even these estimates may be on the low side, as refugee data is constrained by UNHCR’s capacity, which is particularly limited in the Americas due to inadequate funding. In 2023 the UNHCR had an “all time high global backlog” and it took over 400 days from registration to first instance decision. More people likely qualify for refugee status and are awaiting processing by UNHCR but will only be entered into the system (and counted) after they have had the opportunity to register and get through the backlog.
While the U.S. has historically resettled the majority and largest number of refugees compared to other resettlement countries, the combined resettlement efforts of all resettlement countries in 2023 was less than 5% – a small fraction of the world’s refugees. Admissions from Latin America into the U.S. is an even smaller proportion, amounting to less than 0.1%. In fact, 75% of the refugees in the world live in low-income or middle-income countries.
The growing difference between the global refugee population and the U.S. refugee ceiling, as shown in comparing Figure 2 and Figure 3, raises questions as to whether the U.S. refugee commitment has been adequate, and if there are alternative approaches to setting the U.S. refugee admission ceilings.
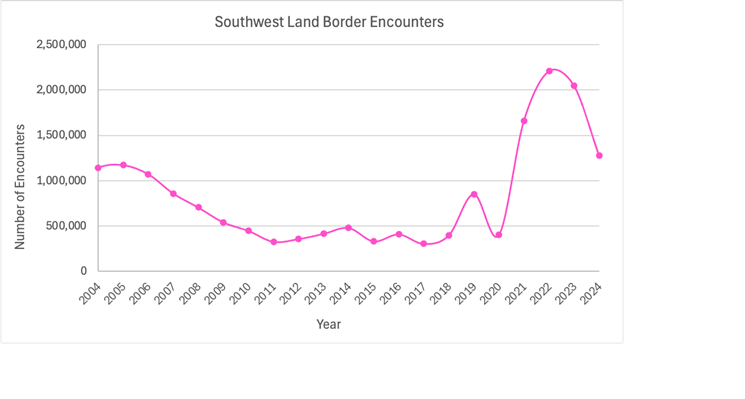
With encounters on the U.S.-Mexico border in 2022 and 2023 reaching record highs (see Figure 4 below), it became critical to prioritize resettlement for persecuted populations from Latin America through more orderly resettlement channels and encourage collaboration toward those ends among responsible parties. Because the U.S. has not traditionally focused on refugee resettlement from Latin America and the Caribbean, aside from Haitians and Cubans, the U.S. will need to build up capacity to address this significant increase in refugees from this region.
Figure 4: 2004-2024 Southwest Land Border Encounters

The U.S. has made some progress on these efforts in recent years. In response to the growing refugee populations worldwide, in Latin America, and the increased encounters of these populations at the U.S. southern border, President Biden set the regional ceiling for Latin America to 35,000-50,000 refugees (out of an overall total of 125,000 refugees) for both FY2024 and FY2025.
UNHCR reported in 2022 that over the past five years the number of asylum seekers and refugees from the region have soared consistent with worldwide trends. Addressing this issue must include collaboration among hosting countries in the region. Because this dynamic shows no sign of ending, it is likely that the U.S. will continue to be a prime destination for many of those fleeing and looking for protection.
Conclusion
Data from Latin America on refugee and asylum trends, refugee admission rates, and encounters at the U.S.-Mexico border are compelling evidence that circumstances are displacing Latin Americans at unprecedented rates.
The increase in migration from Latin America is relatively new and driven by post-COVID circumstances and country-specific factors. This increase is likely to continue in the coming years and the U.S. will need to find ways to address this new reality, most notably expanding refugee resettlement from this region for those seeking protection in the U.S.
____________________________________
Thanks to Reem Turk for her work on this paper.


