
Introduction
The Exchange Visitor Program, also known as the J-1 Visa Program, has been attracting foreign students, teachers and other professionals from around the world to the United States for a short-term work experience. For nearly five decades, the U.S. and the participating countries have found the program to be mutually beneficial. The U.S. benefits from temporary work assistance while participants gain valuable work experience. The nation’s citizens and the J-1 visa holders each attain knowledge, skills, culture, and insights from the other. The Trump administration, nonetheless, has raised concerns that recipients of the Summer Work Travel category, the largest of all the J-1 visa categories, are displacing young Americans from summer jobs.
This paper examines the Summer Work Travel category of the J-1 visa, the individuals receiving these visas, and the program’s effect on U.S. businesses. We find two concurrent trends: Visa recipients help businesses fill seasonal work needs, and young native-born workers are more interested in pursuing extra college credits and internships rather than summer jobs. The findings suggest that reducing the number of visas for the program would harm businesses, native-born workers, and local economies.
J-1 Visa History
U.S. Senator J. William Fulbright introduced the Exchange Visitor Program, or J-1 visa, under the Mutual Educational and Cultural Exchange Act of 1961. The program’s aim is to promote “the interchange of persons, knowledge, and skills, in the fields of education, arts, and science,” according to U.S. Citizenship and Immigration Services.[1] For the past decade, over 310,000 individuals from more than 200 countries have visited the United States each year to participate in both work- and study-based programs.[2] Apart from the International Visitors and Government Visitors categories, the program is privately funded.[3]
Prospective J-1 visa holders may apply to one of 15 different categories that allow them to teach, conduct research, study, or work in the United States for periods ranging from a few weeks to several years.[4] The Summer Work Travel category is the largest of these, followed by other similar, but notably smaller, work-based categories that cover au pairs, camp counselors, interns, and trainees. About a third of all 2017 J-1 recipients (nearly 105,000) were foreign students who visited and worked in the country through Summer Work Travel.[5] Massachusetts and New York attracted the most Summer Work Travel participants, hosting, respectively, about 7,100 and 7,000 J-1 visa holders in 2017 — about 13 percent of total foreign-student participants for that year.[6]
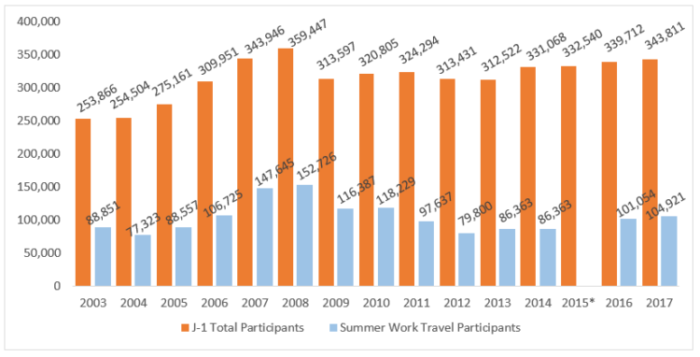
Chart 1 below shows the number of J-1 visas issued per year from 2003 to 2017 as well as figures for Summer Work Travel participants where available. Over the past three decades, the J-1 Visa Program has roughly doubled in size, peaking shortly before the Great Recession. While there is no statutory cap on the overall number of J-1 visas annually available, the State Department capped annual visas at 109,000 for the Summer Work Travel category beginning in 2011.[7]
Chart 1. J-1 Exchange Visitors and Summer Work Travel participants, 2003-2017
For years, the Summer Work Travel program has been facing a variety of criticisms. An Associated Press investigation in 2010 highlighted labor malpractices and exploitation of Summer Work Travel participants. The report sparked criticism that the State Department failed to provide adequate oversight and regulation of the program.[8] A group of Summer Work Travel participants staged a walkout in 2011 to protest working conditions at a chocolate packing plant in Pennsylvania, again calling the visa program’s oversight into question.[9]
Other critics have voiced concerns about the economic impact of the Summer Work Travel program. They assert that, while businesses may profit from tapping into J-1 work-based categories as a source of labor, visa holders may depress employment prospects for young U.S. citizens.[10] During a 2013 Senate debate on immigration, Sen. Bernie Sanders criticized the Summer Work Travel program. He introduced legislation — which did not pass — to eliminate the J-1’s work-based programs, citing high youth unemployment in the U.S.[11
The State Department acknowledged flaws in the Summer Work Travel category and began taking steps in 2012 to improve its oversight and strengthen the program’s requirements. The department set an annual cap of 109,000 participants, enforced cultural exchange requirements, and prohibited placement into certain jobs, such as domestic help and adult entertainment.[12] The department also introduced several provisions to protect U.S. workers. While Summer Work Travel participants are still considered cultural exchange visitors — not guest workers — the department prohibits host employers from displacing local workers at the worksites where they will place J-1 visa recipients.[13] These protections require employers to pay local workers prevailing local wages and prohibit supervisors from staffing non-seasonal and non-temporary positions with exchange visitors. Employers are prohibited from hiring J-1 visa recipients if their businesses have recently faced lay-offs, and/or have workers on strike or locked out. Similar provisions exist for the J-1 visa categories for college and university students, interns, and trainees. The State Department adopted additional rules in January 2017, strengthening regulation and oversight of the Summer Work Travel program, as well as safety and orientation procedures for participants.[14]
Concerns about the program’s future arose in May 2017 when G. Kevin Saba, the acting deputy assistant secretary for the State Department’s Private Sector Exchange division, warned in an email that “emerging Administration policies and themes” would bring sharper scrutiny to certain J-1 programs.[15] During his presidential campaign, President Donald Trump had expressed an interest in eliminating the J-1’s work-based programs and proposed replacing them with “a resume bank for inner city youth provided to all corporate subscribers to the J-1 Visa Program.”[16] In July 2017, however, more than 30 congressional representatives wrote to then Secretary of State Rex Tillerson in support of the Summer Work Travel program, as did 17 senators the following month.[17] Subsequent congressional resolutions in support of the visa program were introduced in both chambers, and the Senate resolution passed without objection.[18] Still, in the fall of 2017, the Trump administration announced that it would review the J-1 Visa Program, due to concerns that exchange visitors displace young Americans from summer jobs.
Evaluating the Impact of Work-Based J-1 Programs
General Trends in Youth Unemployment and Labor Participation
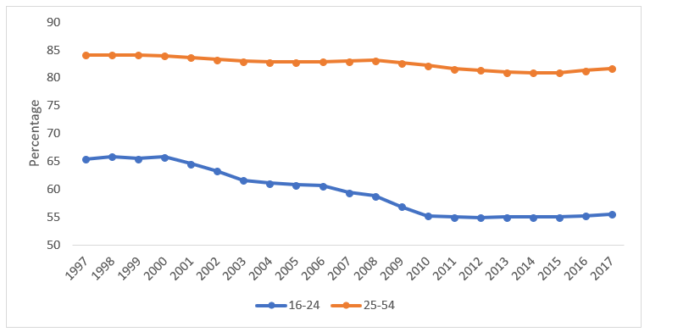
Fewer and fewer young Americans are working seasonal jobs — or even participating in the workforce. Youth workforce participation rates have trended downward over the past decades, declining steadily during the 1990s and 2000s, but remaining fairly stable over the past five years. As shown in Chart 2 below, youth workforce participation rates have dropped substantially, by about 10 percentage points, since 1997. However, participation rates among individuals 25 to 54 years old — or what is known as the “prime working age” group — have stayed around the 83 percent mark for the same time period. A recent report showed that the percentage of teens working summer jobs has tumbled considerably, falling from 51.7 percent in 2000 to 29.6 percent in 2010 before climbing a bit to 35 percent in 2017.[19]
Chart 2. Labor Force Participation Rates, 1997 to 2017
Bureau of Labor Statistics, U.S. Department of Labor. (n.d.). BLS Data Viewer. Retrieved May 17, 2018, from https://beta.bls.gov/dataViewer/view/timeseries/LNS11300060
Bureau of Labor Statistics, U.S. Department of Labor. (n.d.). BLS Data Viewer. Retrieved May 17, 2018, from https://beta.bls.gov/dataViewer/view/timeseries/LNS11324887
Note:
The axes for workforce participation rates are not synchronized in order to better compare the historical trends in participations rates between the two age groups. Rates among the 16-24 age group are generally 18 to 28 percentage points lower than those of the 25-54 age group. Data are seasonally adjusted to highlight long-term trends.
The diverging participation rates between the two groups is likely linked to an increased emphasis on education and enrollment in higher levels of school, particularly among the sub-group of individuals age 16 to 19.[20] More individuals in the U.S. are completing high school and graduating from college than ever before, as the Census Bureau reported in 2017.[21] The rising levels of educational attainment seem to put greater pressure on students to take on more classwork during the summertime, the annual peak for youth workforce participation.
The share of 16- to 24-year-olds enrolled in summer school has almost tripled over the past two decades.[22] Researchers have also noted that more teenagers are doing community service to fulfill graduation requirements and taking on unpaid internships during the summer.[23] Tellingly, the percentage of unemployed teenagers who say they want a job has steadily decreased. In 1994, 20 percent of teens who were outside the labor force said that they wanted a job. This figure declined by about half and has remained in the 9 to 10 percent range since 2007.[24] In short, the past decades have revealed a growing shift away from low-skilled summer jobs and toward academically or professionally oriented opportunities.
Demand for low-skill labor, however, is high. Of the occupations projected to have the most job openings each year from 2016 to 2026, almost half required no formal education.[25] Worryingly, labor force projections also show eroding labor supply. The share of 16- to 34-year-olds in the labor force is expected to continue a downward trend through 2026, while the share of workers 55 and over is expected to be more than double what is was in 1996.[26] With the economy now near or at full employment, employers likely will have more acute difficulties in meeting the demand for these occupations.[27]
J-1 Participants Play Important Role at U.S. Workplaces
Recent survey data collected from U.S. businesses hosting Summer Work Travel participants suggest that foreign exchange visitors do help fill labor shortages in important ways. In a study commissioned by the Alliance for International Exchange, an umbrella organization for sponsors of the J-1 visa, almost all businesses surveyed reported facing labor shortages.[28] More than 87 percent of employers said that their ability to conduct business would have been “negatively impacted” if Summer Work Travel visitors had not participated the previous season; 69 percent reported that it would have a “big negative impact” and 18 percent said it would have “some negative impact.”[29]
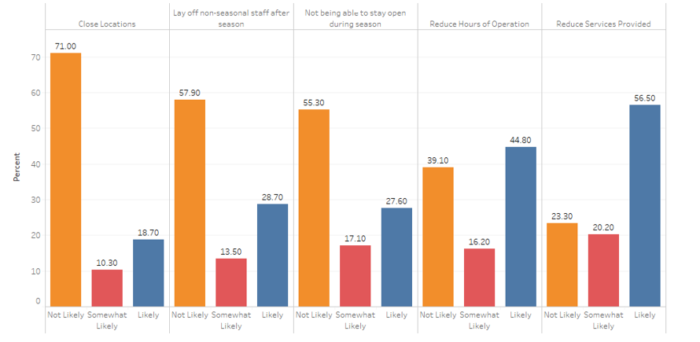
Employers were asked about specific negative consequences of the loss of Summer Work Travel visitors, which are summarized in Chart 3. While most host businesses and organizations said such a loss was not likely to force them to close locations, many indicated that they would have to reduce the numbers of hours they operate and the services they provide to customers. More than 40 percent of businesses said such a loss would likely, or somewhat likely, result in laying off American employees in non-seasonal positions. This data point suggests that the elimination of the Summer Work Travel program would negatively affect not only American businesses, but also the employment prospects of local workers.
Chart 3. Consequences If Host Business or Organization Did Not Employ Summer Work Travel Participants
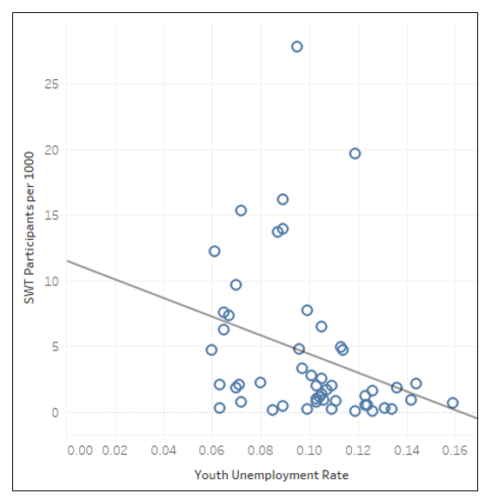
The data on the locations where Summer Work Travel participants work show little evidence that visitors displace local workers. Chart 4 shows a scatter plot graph marking the relationship between the youth unemployment rate and the ratio of Summer Work Travel participants that each U.S. state hosts. Overall, the data suggest that the higher the youth unemployment rate in a state, the fewer Summer Work Travel participants that state attracts.
Chart 4. Youth Unemployment Rates vs. Summer Work Travel Participants per 1,000 individuals age 15-24, by U.S. State, 2016
U.S. Department of State, Facts and Figures. (n.d.). Retrieved May 14, 2018, from https://j1visa.state.gov/basics/facts-and-figures/
Governing, “Youth Unemployment Rate, Figures by State,” Data | Economy/Finance, accessed April 10, 2018, http://www.governing.com/gov-data/economy-finance/youth-employment-unemployment-rate-data-by-state.html
U.S. Census Bureau. (2017, June). Annual Estimates of the Resident Population for Selected Age Groups by Sex for the United States, States, Counties, and Puerto Rico Commonwealth and Municipios: April 1, 2010 to July 1, 2016. Retrieved from https://factfinder.census.gov/faces/tableservices/jsf/pages/productview.xhtml?pid=PEP_2016_PEPAGESEX&prodType=table
Note:
The trend line suggests U.S. states with high youth unemployment rates have fewer Summer Work Travel participants.
June, J. (2018, May 24). SWT Participants and Youth Unemployment Rate (All States). Retrieved from https://public.tableau.com/profile/jae.june#!/vizhome/SWTParticipantsandYouthUnemploymentRateAllStates/Sheet1?publish=yes
Moreover, the number of Summer Work Travel participants may be too small to have a meaningful impact on youth unemployment rates. For every 1,000 individuals age 15 to 24 in a given U.S. state, there are two Summer Work Travel participants.[30] (In Wyoming, which has the country’s highest ratio of Summer Work Travel participants to young residents, the program’s participants account for about 3 percent of the population age 15 to 24.) This is an indication that concerns about displaced American workers may be overstated. Overall, Summer Work Travel participants account for the equivalent of less than half a percent of the total youth labor force in the United States — around 0.4 percent in July 2017.[31] Summer Work Travel participants worked in 242 of the 388 metropolitan statistical areas across the U.S. in 2016. Half of these 242 statistical areas hosted fewer than 22 Summer Work Travel participants, while only nine areas, less than 4 percent, had more than 1,000 Summer Work Travel participants that year.[32]
Although Summer Work Travel participants do not displace young U.S. workers, the two groups do seem to work in overlapping industries. Chart 5 below shows the top non-agricultural industries in the private sector, which employ about 90 percent of all young American workers. Two industries — leisure and hospitality, and retail trade — employ the greatest numbers of young Americans. Nearly 50 percent of young Americans are employed in one of these sectors.[33] More than 30 percent of all Summer Work Travel participants work in the “service sector,” a category that includes leisure and hospitality, retail trade, and other sectors.[34] More detailed and reliable data on the industries that employ J-1 visitors are required. This preliminary sketch suggests that foreign exchange workers and young U.S. workers endeavor in overlapping industries — potentially competing for similar jobs.
Chart 5. Youth Employment by Private Sector Non-Agricultural Industries, July 2016
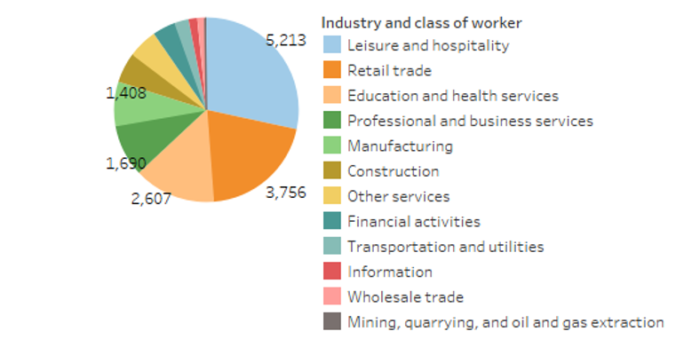
Note: The chart provides figures only for individuals age 16 to 24, employed in non-agricultural industries that include private wage and salary workers but exclude government wage and salary workers and self-employed, unincorporated, and unpaid family workers. Numbers are in thousands. Data are not seasonally adjusted.
Summer Work and Travel Participants Help Employers in the Southeast
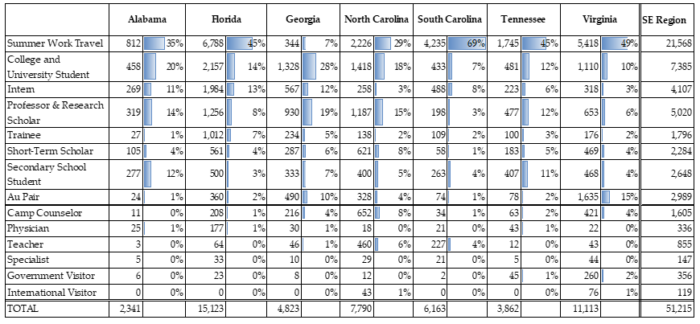
In our case study, we examine the seven states in the southeast — Florida, Alabama, Georgia, Tennessee, Virginia, South Carolina, and North Carolina. In 2016, more than 51,000 J-1 Exchange visitors traveled to the seven states, accounting for about 16 percent of total J-1 visitors to the country. When compared with other states, the Southeast shows similar overall trends: the size of each category, relative to the overall size of each state’s J-1 program, is roughly the same. However, there is one notable exception. The region seems to attract a greater share of participants in Summer Work Travel when compared with the country as a whole. While Summer Work Travel participants account for 31 percent of the total number of J-1 visas issued, 42 percent of these participants come to this region alone. As shown in the state-by-state breakdown (Table 2), almost all of the selected Southeast states have higher or similar shares of Summer Work Travel participants compared with the national average of 31 percent. The two outliers are Georgia and South Carolina, where Summer Work Travel participants account for only 7 percent of all J-1 visas in Georgia, and almost 69 percent in South Carolina.
Table 1. Total Participants by J-1 Programs, Select SE Region and All U.S. States Compared
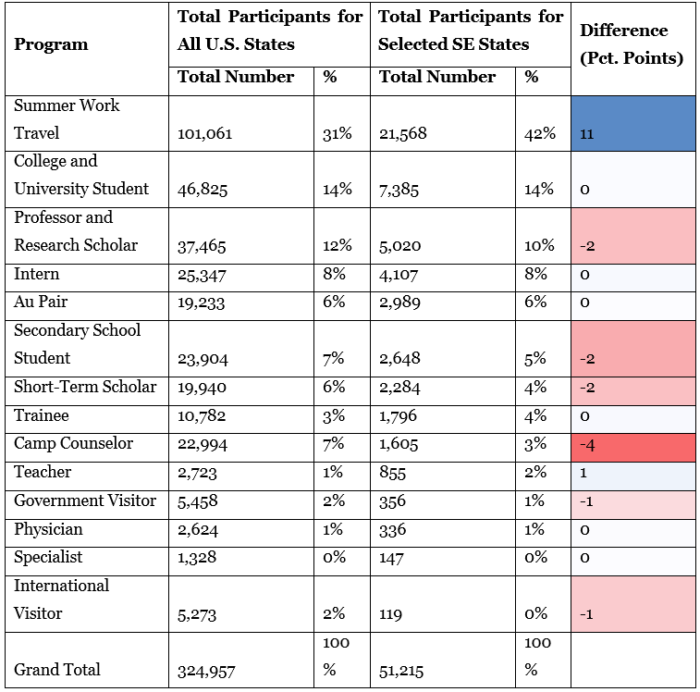
Table 2. Participants by J-1 Program in Selected SE States, 2016
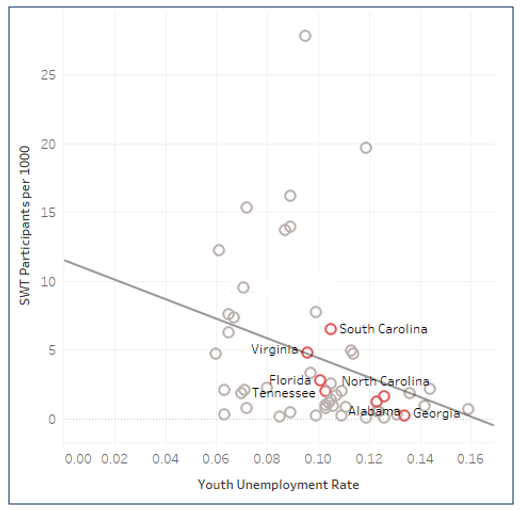
Furthermore, the correlation between the U.S. youth unemployment rate and the number of Summer Work Travel participants in the selected Southeast states (Chart 6) suggests that states with higher youth unemployment rates generally tend to accept fewer J-1 visa students. Georgia, Alabama, and North Carolina, for example, have relatively higher youth unemployment rates and also host fewer foreign students. In contrast, Virginia has the lowest youth unemployment rate of all the selected states and the second highest number of Summer Work Travel participants.
As the analysis of these Southeast states suggests, foreign students who visit the U.S. through the Summer Work Travel program do not compete with young American workers; rather, they help employers who struggle to fill seasonal jobs amid a lack of young U.S. workers.
Chart 6. Youth Unemployment Rates vs. Number of Summer Work Travel Participants in Selected U.S. States, 2016
Conclusion
Exchange visitors help U.S. businesses close significant labor gaps and are a vital and important part of our temporary workforce. Specifically, the Summer Work Travel program allows young foreign students the chance to fill seasonal jobs at a time when U.S. summer employment rates for youth are falling. More U.S. teen and college students are opting for summer education or the opportunity to gain professional experience through internships. Many employers believe that cuts to the Summer Work Travel program would likely force them to reduce operating hours and services to their customers. Moreover, they may be forced to lay off American employees from their year-round positions.
As findings in this paper show, foreign students do not displace young American workers. Summer Work Travel participants play an important role in our economy, helping U.S. businesses thrive.
Appendix 1
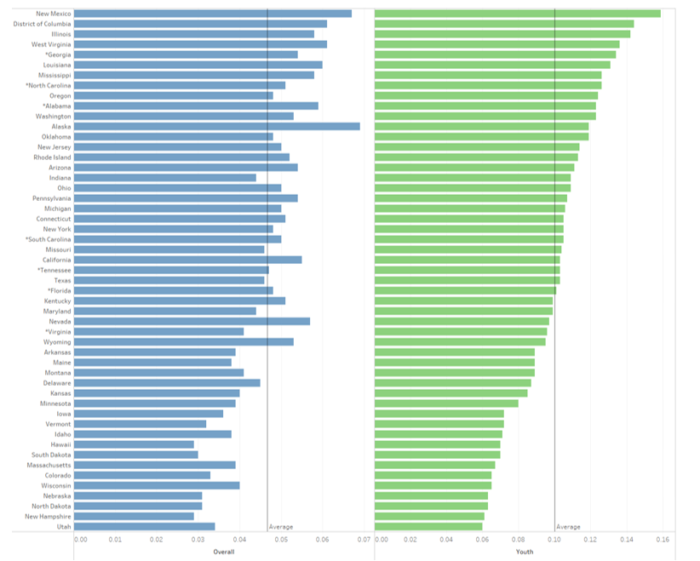
Overall and Youth Unemployment Rates by U.S. State, 2016 Annual Data
This chart compares overall and youth unemployment rates in each of the U.S. states.
Governing. “Youth Unemployment Rate, Figures by State,” Data | Economy/Finance, accessed April 10, 2018, http://www.governing.com/gov-data/economy-finance/youth-employment-unemployment-rate-data-by-state.html
RI Department of Labor and Training. “Unemployment Rates for States: Annual Average Rankings, 2010 – Present”, Labor Market Information, accessed April 10, 2018, http://www.dlt.ri.gov/lmi/laus/us/annavg.htm
Note:
The seven states that make up this paper’s case study — Alabama, Florida, Georgia, North Carolina, South Carolina, Tennessee, and Virginia — are marked with an asterisk.
Appendix 2
Chart 1. Workforce Participation Rates for 16- to 24-year-olds (Unadjusted), 2017
As this chart for 2017 suggests, workforce participation of U.S. youth increases during summertime, when most young Americans do not attend school.
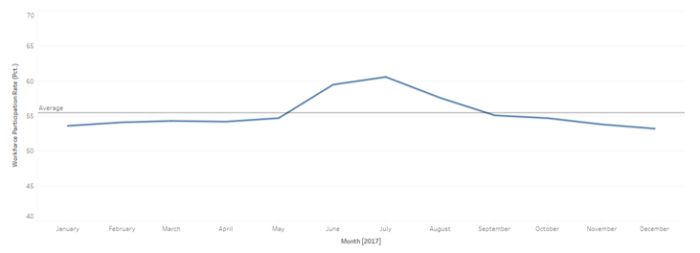
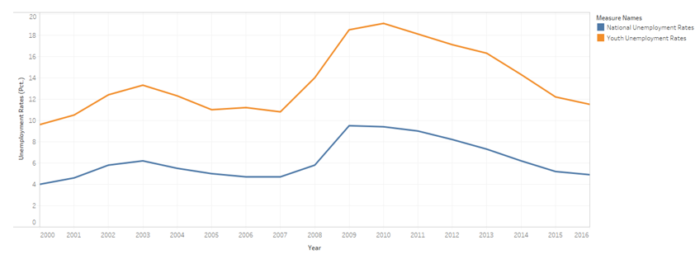
Chart 2. National and Youth Unemployment Rates Compared, 2000-2016
Since the month of July is typically considered the summertime peak for youth work participation and employment and the focus of this paper is on summertime employment, this chart shows employment rates for July of each year from 2000 to 2016.
The National Immigration Forum would like to thank Jae June Lee, policy intern, for his extensive contributions to this paper.
[1] U.S. Citizenship and Immigration Services. (2015, July). Exchange Visitors. Retrieved May 14, 2017, from https://www.uscis.gov/working-united-states/students-and-exchange-visitors/exchange-visitors
[2] Cepla, Z. (2018, March 19). Fact Sheet: Exchange Visitor Program (J-1 Visa). Retrieved from https://forumtogether.org/article/factsheet-exchange-visitor-program-j-1-visa/
[3] U.S. Department of State. J-1 Visa Exchange Visitor Program: Connecting People, Creating Understanding. (2018, March). Retrieved August 23, 2018, from https://j1visa.state.gov/wp-content/uploads/2018/03/J1VIsa-fact-sheet-2018.pdf
[4] U.S. Department of State. J-1 Visa Exchange Visitor Program: Connecting People, Creating Understanding. (2018, March). Retrieved August 23, 2018, from https://j1visa.state.gov/wp-content/uploads/2018/03/J1VIsa-fact-sheet-2018.pdf
[5] U.S. Department of State. Visa Statistics. (n.d.). Retrieved May 14, 2018, from https://travel.state.gov/content/travel/en/legal/visa-law0/visa-statistics.html
Interagency Working Group. Annual Reports. (n.d.). Retrieved May 14, 2018, from https://iawg.gov/reports/annual-reports/
U.S. Department of State. Facts and Figures. (n.d.). Retrieved May 14, 2018, from https://j1visa.state.gov/basics/facts-and-figures/
[6] U.S. Department of State. Facts and Figures. (n.d.). Retrieved May 14, 2018, from https://j1visa.state.gov/basics/facts-and-figures/
[7] American Immigration Council. The Exchange Visitor Program and J-1 Visas. (2016, May 26). Retrieved May 14, 2018, from https://www.americanimmigrationcouncil.org/research/exchange-visitor-program-and-j-1-visas
[8] AP IMPACT: US fails to tackle student visa abuses. (2010, December 6). Retrieved from http://www.foxnews.com/us/2010/12/06/ap-impact-fails-tackle-student-visa-abuses.html
[9] Preston, J. (2011, October 17). Pleas Unheeded as Students’ U.S. Jobs Soured. Retrieved from https://www.nytimes.com/2011/10/17/us/hershey-foreign-exchange-students-pleas-were-ignored.html
[10]Chang, C. (2015, July 7). Amending J-1 Visa Program Could Boost Job Opportunities for American Youth. Retrieved from https://tcf.org/content/report/amending-j-1-visa-program-could-boost-job-opportunities-for-american-youth/?session=1&agreed=1
[11] Meckler, L. (2017, August 27). Trump Administration Considering Cuts to Cultural Exchange Visas. Retrieved from https://www.wsj.com/articles/trump-administration-considering-cuts-to-summer-work-visas-1503857856
[12] Courts, M. (2015, March 13). Summer Work Travel Program: State Department Has Taken Steps to Strengthen Program Requirements, but Additional Actions Could Further Enhance Oversight. Retrieved from https://www.gao.gov/products/GAO-15-265
[13] Electronic Code of Federal Regulations. (2018, August 21). Retrieved April 27, 2018, from https://www.ecfr.gov/cgi-bin/retrieveECFR?gp=&SID=1bc531bf257789e45b3049bff8b50d64&r=PART&n=22y1.0.1.7.35#se22.1.62_132
[14] U.S. Department of State. Exchange Visitor Program—Summer Work Travel. (2017, January 12). Retrieved from https://j1visa.state.gov/wp-content/uploads/2017/01/9522_PublishedFR_01-12-2017.pdf
[15] Itkowitz, C. (2017, September 10). Au pairs and other short-term foreign workers fear losing visas under Trump review. Retrieved from https://www.washingtonpost.com/local/families-camps-and-businesses-rally-to-protect-j-1-visa-program/2017/09/10/907944c8-93fd-11e7-aace-04b862b2b3f3_story.html?utm_term=.cadf6c9d84b7
[16] Immigration Reform That Will Make America Great Again. (n.d.). Retrieved May 10, 2018, from https://assets.donaldjtrump.com/Immigration-Reform-Trump.pdf
[17] LoBiondo, F. A. (n.d.). [Letter written July 12, 2017 to Rex W. Tillerson]. Retrieved from https://gallery.mailchimp.com/92b9c3eeaf23cd6039926e0fd/files/9a0ddb7a-0e0c-4030-b4db-16669add27cc/LoBiondo_SupportLetterSWTProgram_July2017.pdf
Johnson, R. (n.d.). [Letter written August 8, 2017 to Rex W. Tillerson]. Retrieved from https://static1.squarespace.com/static/5900f8cdd1758e2cf2e283dc/t/598c77bfcd0f686159d63f87/1502377921581/J-1 Visa Letter- 08-08-2017.pdf
[18] LoBiondo, F. (2017, September 27). H.Res.529 – 115th Congress (2017-2018): Expressing the sense of the House of Representatives that the J-1 visa programs, specifically the Summer Work Travel, Au Pair, Camp Counselor, and Intern and Trainee programs, are vital to the economy and national interests of the United States and the Congress should continue to monitor the administration of these programs in their current form. Retrieved from https://www.congress.gov/bill/115th-congress/house-resolution/529
Merkley, J. (2017, December 12). S.Res.357 – 115th Congress (2017-2018): A resolution expressing the sense of the Senate that international education and exchange programs further United States national security and foreign policy priorities, enhance United States economic competitiveness, and promote mutual understanding and cooperation among nations, and for other purposes. Retrieved from https://www.congress.gov/bill/115th-congress/senate-resolution/357
[19] DeSilver, D. (2018, July 02). The share of teens with summer jobs has plunged since 2000, and the type of work they do has shifted. Retrieved from http://www.pewresearch.org/fact-tank/2018/07/02/the-share-of-teens-with-summer-jobs-has-plunged-since-2000-and-the-type-of-work-they-do-has-shifted/
[20] Canon, M. E., Kudlyak, M., & Liu, Y. (2015, January). Youth Labor Force Participation Continues To Fall, but It Might Be for a Good Reason. Retrieved from https://www.stlouisfed.org/publications/regional-economist/january-2015/youth-labor-force
[21] US Census Bureau. (2017, March 30). Highest Educational Levels Reached by Adults in the U.S. Since 1940. Retrieved from https://www.census.gov/newsroom/press-releases/2017/cb17-51.html
US Census Bureau. (2017, December 14). High School Completion Rate Is Highest in U.S. History. Retrieved from https://www.census.gov/newsroom/press-releases/2017/educational-attainment-2017.html
[22] Bureau of Labor Statistics. (2011, July). How Many Young Adults are we Talking About? Retrieved from https://www.bls.gov/spotlight/2011/schools_out/
[23] DeSilver, D. (2015, June 23). The fading of the teen summer job. Retrieved from http://www.pewresearch.org/fact-tank/2015/06/23/the-fading-of-the-teen-summer-job/
Rubenstein, M. (2014, March 10). The Interns Are Getting Younger: High Schoolers Hit the Workplace. Retrieved from https://www.nbcnews.com/news/education/interns-are-getting-younger-high-schoolers-hit-workplace-n45146
[24] Bureau of Labor Statistics, U.S. Department of Labor. (2017, February 01). Teen labor force participation before and after the Great Recession and beyond: Monthly Labor Review. Retrieved from https://www.bls.gov/opub/mlr/2017/article/teen-labor-force-participation-before-and-after-the-great-recession.htm
[25] Bureau of Labor Statistics, U.S. Department of Labor. (2018, April 13). Most New Jobs: Occupational Outlook Handbook. Retrieved from https://www.bls.gov/ooh/most-new-jobs.htm
[26] Bureau of Labor Statistics, U.S. Department of Labor. (2017, November). Projections of the labor force, 2016–26: Career Outlook. Retrieved from https://www.bls.gov/careeroutlook/2017/article/projections-laborforce.htm
[27] In April 2018, the national unemployment rate dropped to a near 18-year low of 3.9 percent, after standing at 4.1 percent for the sixth consecutive month. The summertime youth unemployment rate also hit a near 18-year low, dropping to 9.6 percent in July 2017. (Global youth unemployment is 14 percent and the average for OECD countries is 12 percent.)
Bureau of Labor Statistics, U.S. Department of Labor. (2018, August 16). Employment and Unemployment Among Youth Summary. Retrieved from https://www.bls.gov/news.release/youth.nr0.htm
The World Bank Group. (2017, November). Unemployment, youth total (% of total labor force ages 15-24) (modeled ILO estimate). Retrieved May 17, 2018, from https://data.worldbank.org/indicator/SL.UEM.1524.ZS
OECD (2018), Youth unemployment rate (indicator). doi: 10.1787/c3634df7-en. Retrieved May 17, 2018, from https://data.oecd.org/unemp/youth-unemployment-rate.htm
[28] Restrepo, J. (2017, August 22). Summer Work Travel (SWT): Program Review. Retrieved from https://www.eurekafacts.com/phocadownload/SWT Impact Evaluation Final Report.pdf
[29] Restrepo, J. (2017, August 22). Summer Work Travel (SWT): Program Review. Retrieved from https://www.eurekafacts.com/phocadownload/SWT Impact Evaluation Final Report.pdf
[30] The median number of Summer Work Travel participants is two.
[31] 100,000 Summer Work Travel participants / youth labor force of 23.1 million in July 2017.
[32] Restrepo, J. (2017, August 22). Summer Work Travel (SWT): Program Review. Retrieved from https://www.eurekafacts.com/phocadownload/SWT Impact Evaluation Final Report.pdf
[33] Neither a state-by-state breakdown of these figures nor equivalent data for J-1 foreign exchange visitors was available. The EurekaFacts paper does present some data on Summer Work Travel participants, but its survey categories do not exactly line up with the Bureau of Labor Statistics categories in Chart 5.
[34] Restrepo, J. (2017, August 22). Summer Work Travel (SWT): Program Review. Retrieved from https://www.eurekafacts.com/phocadownload/SWT Impact Evaluation Final Report.pdf